Copyright
©The Author(s) 2015.
World J Gastroenterol. Apr 7, 2015; 21(13): 3876-3887
Published online Apr 7, 2015. doi: 10.3748/wjg.v21.i13.3876
Published online Apr 7, 2015. doi: 10.3748/wjg.v21.i13.3876
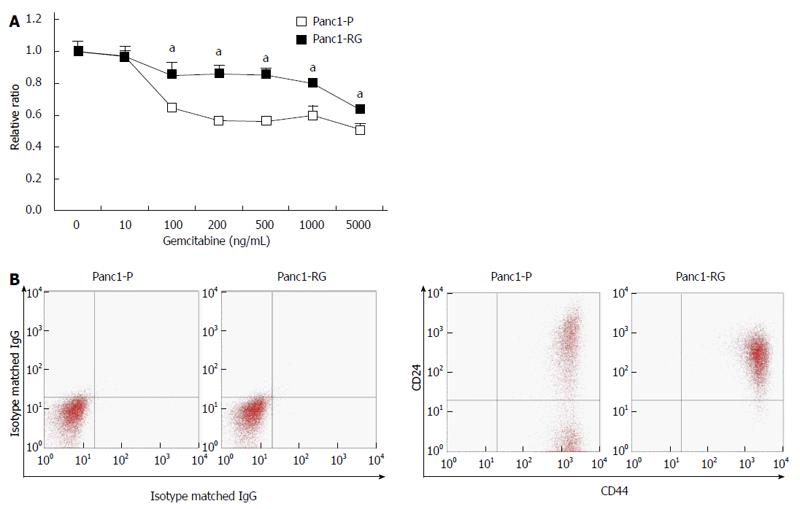
Figure 1 Cancer stem cells are enriched in established gemcitabine-resistant cells.
A: Panc1-RG cells were established by long-term step-wise gemcitabine treatment. WST assay showed that Panc1-RG cells exhibited gemcitabine resistance compared with Panc1-P cells; B: Flow cytometric analysis showing a higher ratio of CD24+/CD44+ cells in Panc1-RG cells compared with Panc1-P cells. All results are expressed as mean ± SD; aP < 0.05 vs Panc1-P cells.
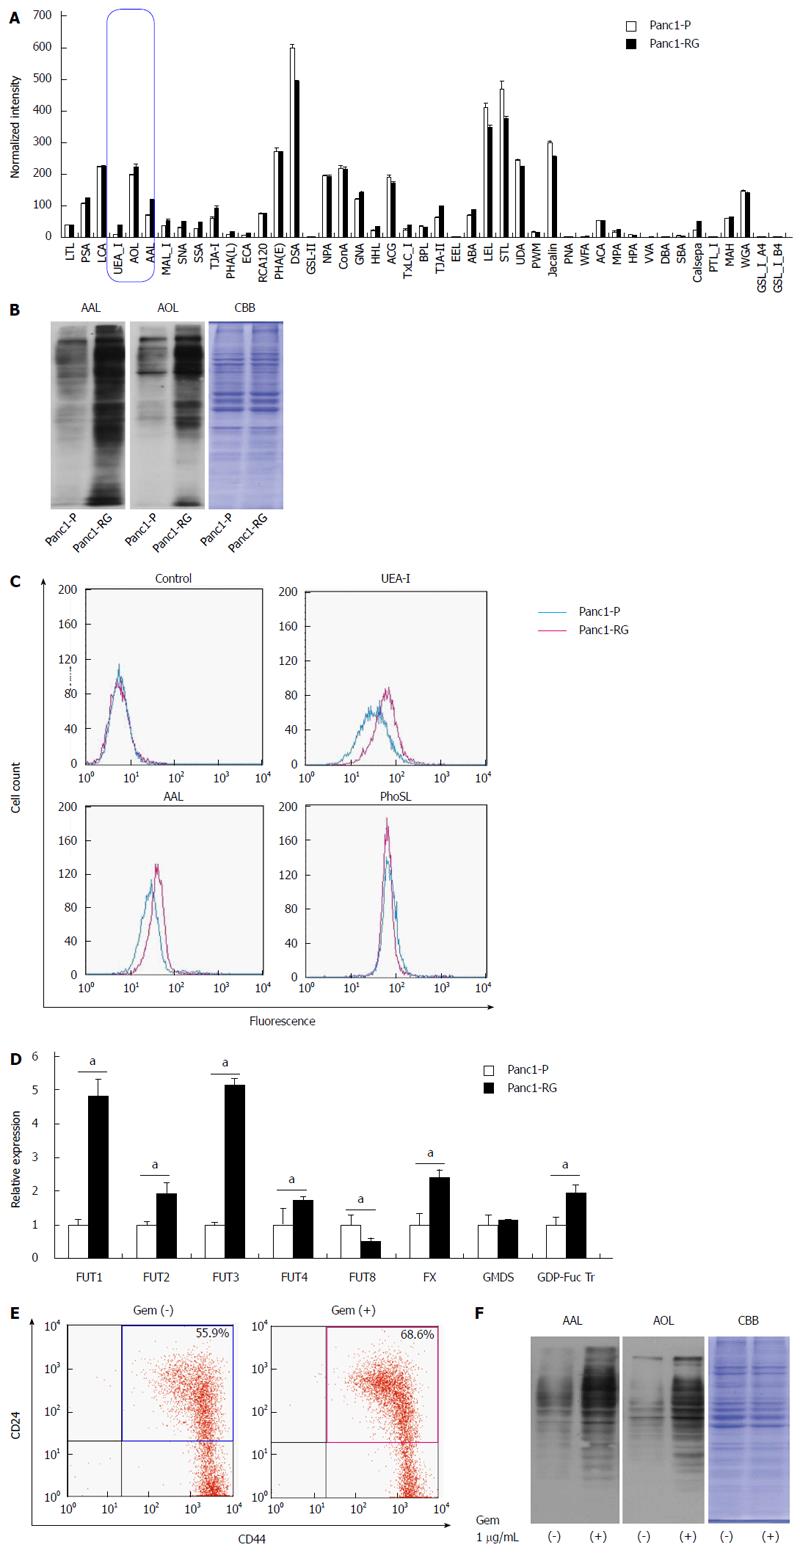
Figure 2 Fucosylation is enhanced in gemcitabine-treated pancreatic cancer cells.
A: Differential glycan profiles of Panc1-P and Panc1-RG cells were analyzed by lectin microarray. The fluorescence intensity of each lectin was normalized to the intensity of wheat germ agglutinin; B: Aleuria aurantia lectin (AAL) or Aspergillus oryzae lectin (AOL) lectin blot of Panc1-P and Panc1-RG. Coomassie brilliant blue (CBB) staining confirms equal protein loading among lanes; C: Cell-surface fucosylated glycoproteins in Panc1-P and Panc1-RG cells were assessed by flow cytometry using Ulex europaeus agglutinin (UEA)-I, AAL, and Pholiota squarrosa lectin (PhoSL) lectins; D: Fucosylation-related gene expression, determined by real-time reverse transcription PCR in Panc1-P and Panc1-RG cells, and expressed relative to that of Panc1-P cells; E: Flow cytometric analysis represented gemcitabine treatment increased the ratio of CD24+/CD44+ cells in PK59 cells; F: AAL or AOL lectin blot of PK59 cells with (+) or without (-) gemcitabine treatment. All results are expressed as mean ± SD; aP < 0.05 vs Panc1-P cells.
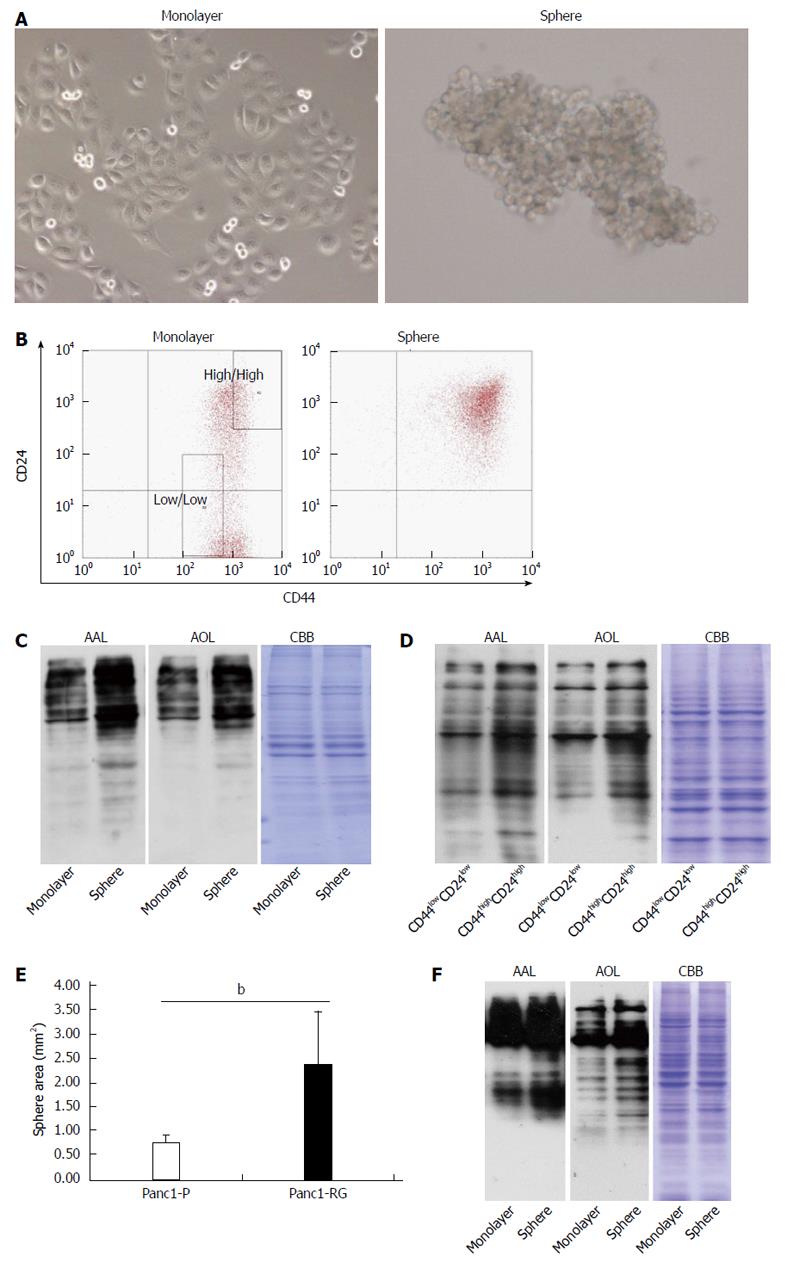
Figure 3 Fucosylation is enhanced in cancer stem cell-like cells fractions of pancreatic cancer cells.
A: Phase-contrast images of monolayer (left panel) and sphere cells (right panel) derived from Panc1 cells; B: Results of flow cytometric analysis in monolayer and sphere Panc1 cells using CD24 and CD44 antibodies. CD24+/CD44+ cells were increased in sphere cells compared with monolayer cells; C: Aleuria aurantia lectin (AAL) or Aspergillus oryzae lectin (AOL) lectin blot of monolayer and sphere Panc1 cells; D: AAL or AOL lectin blot of CD24high/CD44high or CD24low/CD44low Panc1 cells obtained by cell sorting. Each region is indicated as a square field in (B); E: Comparison of sphere cell-forming ability between Panc1-P and Panc1-RG; F: AAL or AOL lectin blot of monolayer and PSN-1 cells. Results are expressed as mean ± SD; bP < 0.01 vs Panc1-P cells. CBB: Coomassie brilliant blue.
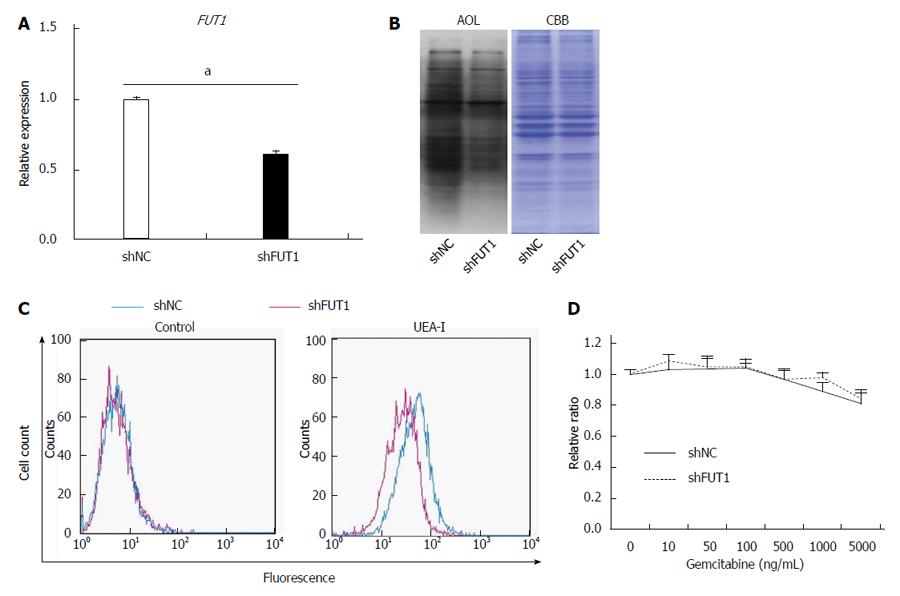
Figure 4 FUT1 knockdown in Panc1-RG cells does not alter gemcitabine resistance.
A: Expression of fucosyltransferase (FUT)1 mRNA in Panc1-RG cells stably expressing small hairpin (sh)RNA; B: Aspergillus oryzae lectin (AOL) blot of shNC- or shFUT1-expressing Panc1-RG cells; C: Flow cytometric analysis using Ulex europaeus agglutinin (UEA)-I; D: WST assay results of transfectant cells treated with various gemcitabine concentrations. Results are expressed as mean ± SD; aP < 0.05 vs shNC. CBB: Coomassie brilliant blue; NC: Negative control.
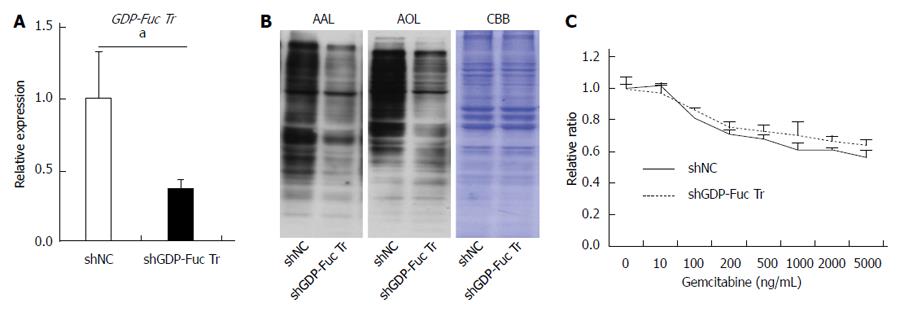
Figure 5 GDP-fucose transporter gene knockdown does not affect gemcitabine resistance in Panc1-RG cells.
A: Expression of GDP-fucose transporter (GDP-Fuc Tr) mRNA in small hairpin (sh)RNA-expressing Panc1-RG cells; B: Aleuria aurantia lectin (AAL) or Aspergillus oryzae lectin (AOL) blots for shRNA transfectant cells; C: WST assay results for cells treated with various gemcitabine concentrations. Results are expressed as mean ± SD; aP < 0.05 vs shNC. CBB: Coomassie brilliant blue; NC: Negative control.
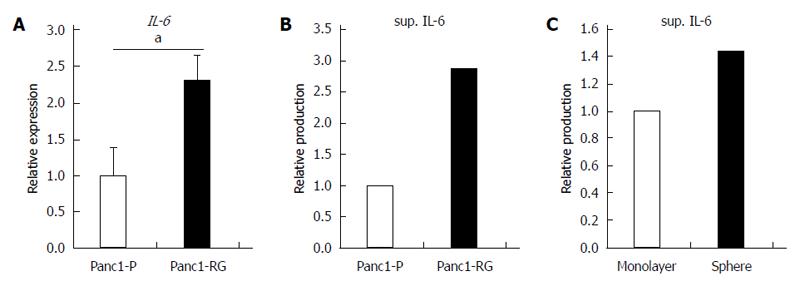
Figure 6 Increased interleukin-6 production in anti-cancer drug-resistance and sphere-forming cells.
A: Expression of interleukin (IL)-6 mRNA was measured by real-time reverse transcription PCR in Panc1-P and Panc1-RG; B: The concentration of IL-6 in conditioned media from Panc1-P or Panc1-RG cultures was assessed by enzyme-linked immunosorbent assay (ELISA); C: The concentration of IL-6 in conditioned media from monolayer or sphere-forming Panc1-P cells was measured by ELISA. All results are expressed as mean ± SD; aP < 0.05 vs Panc1-P cells.
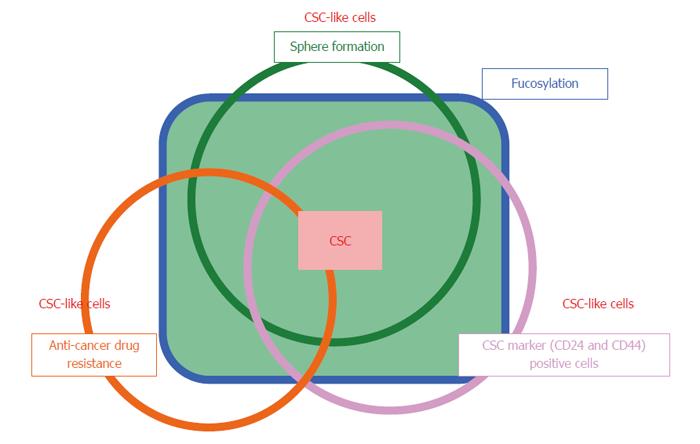
Figure 7 Overview of the relationship between fucosylation and three types of cancer stem cell-like cells.
Cancer stem cells (CSCs) are a limited fraction of cancer cells, which show asymmetric and slow growth, anti-cancer drug resistance, and sphere formation. CSC-like cells are differentiated from and have similar biologic characteristics of CSCs. Fucosylation is common type of glycosylation in the CSC-like phenotype of pancreatic cancer under various conditions.
- Citation: Terao N, Takamatsu S, Minehira T, Sobajima T, Nakayama K, Kamada Y, Miyoshi E. Fucosylation is a common glycosylation type in pancreatic cancer stem cell-like phenotypes. World J Gastroenterol 2015; 21(13): 3876-3887
- URL: https://www.wjgnet.com/1007-9327/full/v21/i13/3876.htm
- DOI: https://dx.doi.org/10.3748/wjg.v21.i13.3876


