Copyright
©The Author(s) 2015.
World J Gastroenterol. Mar 28, 2015; 21(12): 3619-3627
Published online Mar 28, 2015. doi: 10.3748/wjg.v21.i12.3619
Published online Mar 28, 2015. doi: 10.3748/wjg.v21.i12.3619
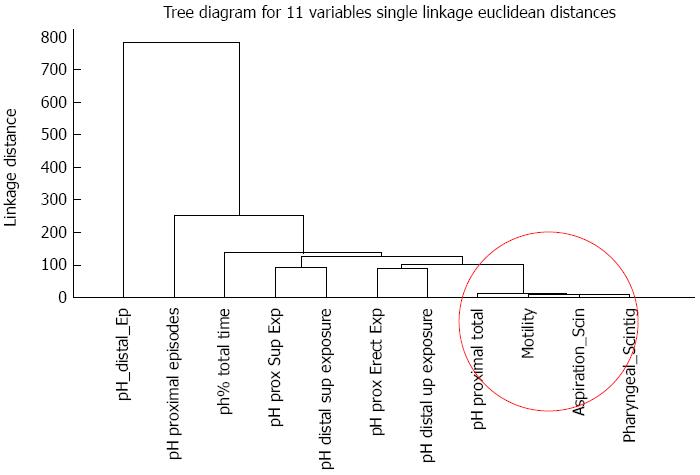
Figure 1 Cluster analysis of variables.
There is tight clustering of pH proximal total exposure, Motility, Aspiration scintigraphy and Pharyngeal scintigraphy located at the far right side of the graph.
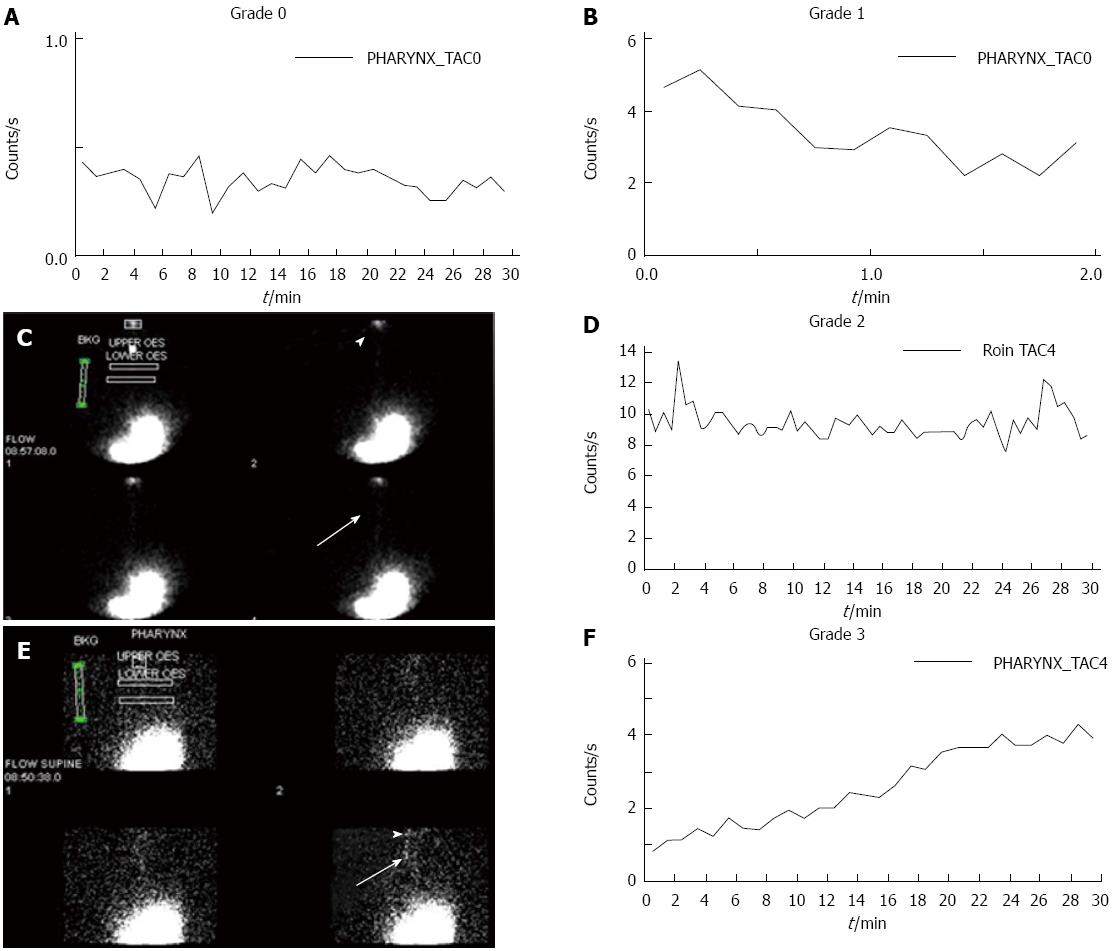
Figure 2 Grading of time-activity curves for the pharynx and upper oesophagus.
A: Grade 0 is where there is no significant activity and the curve is similar to the background time-activity curve; B: Grade 1 reflects activity that clears with a falling curve; C, D: Grade 2 is a time activity curve that correlates with activity in the pharynx (arrowhead) and oesophagus (arrow) that fails to clear; E, F: Grade 3 is a rising time-activity curve that indicates progressive gastro-oesophageal reflux (arrowhead and arrow) that indicates rising activity in the pharynx and upper oesophagus respectively.
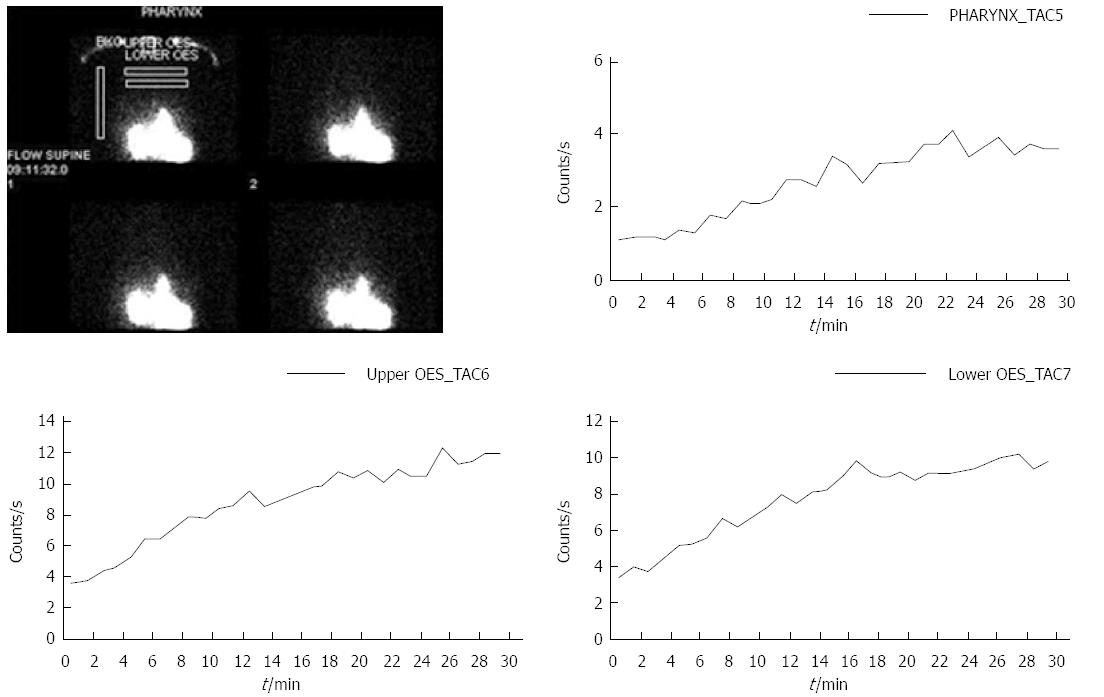
Figure 3 Full column reflux with rising time-activity curves over the pharynx, upper and lower oesophagus.
The diagram shows the typical regions of interest from which the data is derived.
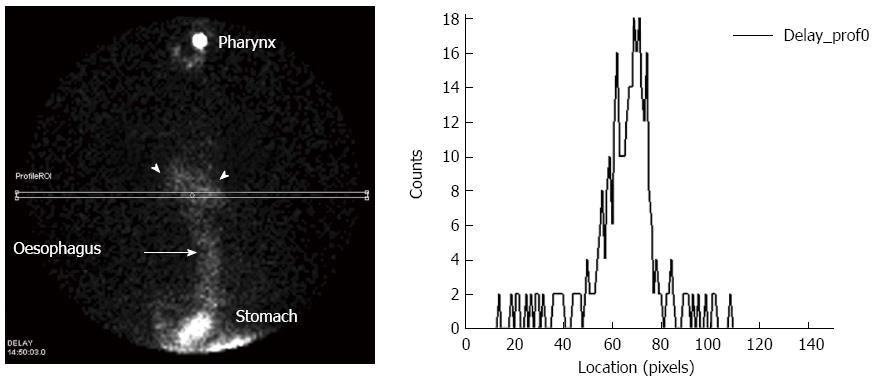
Figure 4 Typical image of the delayed study in which tracer activity is present in the main airways in a patient with lung aspiration.
- Citation: Falk GL, Beattie J, Ing A, Falk S, Magee M, Burton L, Wall HVD. Scintigraphy in laryngopharyngeal and gastroesophageal reflux disease: A definitive diagnostic test? World J Gastroenterol 2015; 21(12): 3619-3627
- URL: https://www.wjgnet.com/1007-9327/full/v21/i12/3619.htm
- DOI: https://dx.doi.org/10.3748/wjg.v21.i12.3619


