Copyright
©The Author(s) 2015.
World J Gastroenterol. Mar 14, 2015; 21(10): 2926-2936
Published online Mar 14, 2015. doi: 10.3748/wjg.v21.i10.2926
Published online Mar 14, 2015. doi: 10.3748/wjg.v21.i10.2926
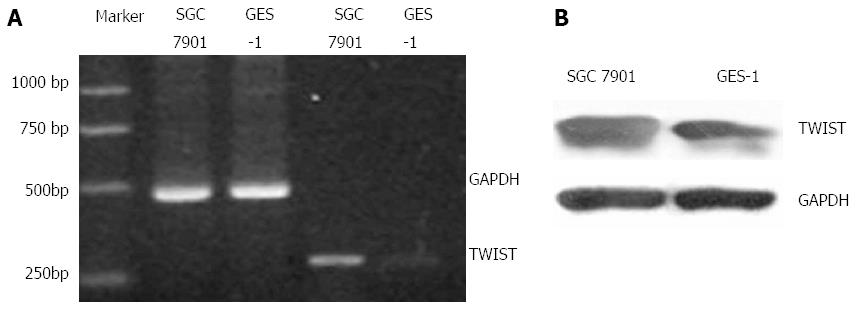
Figure 1 Expression level of Twist in SGC7901 gastric cancer cells and human gastric epithelium GES-1 cells determined by RT-PCR (A) and Western blot (B).
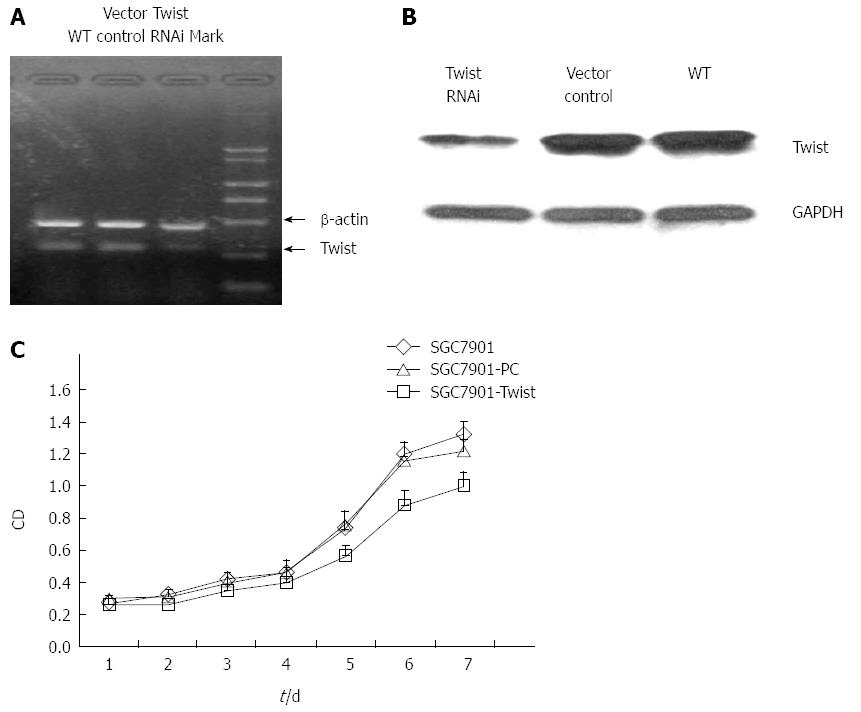
Figure 2 Twist expression in stably silenced SGC7901 cells as determined by RT-PCR and Western blot (A and B); Growth curve of stable transfected cells.
Data were averaged for the three independent experiments (C).
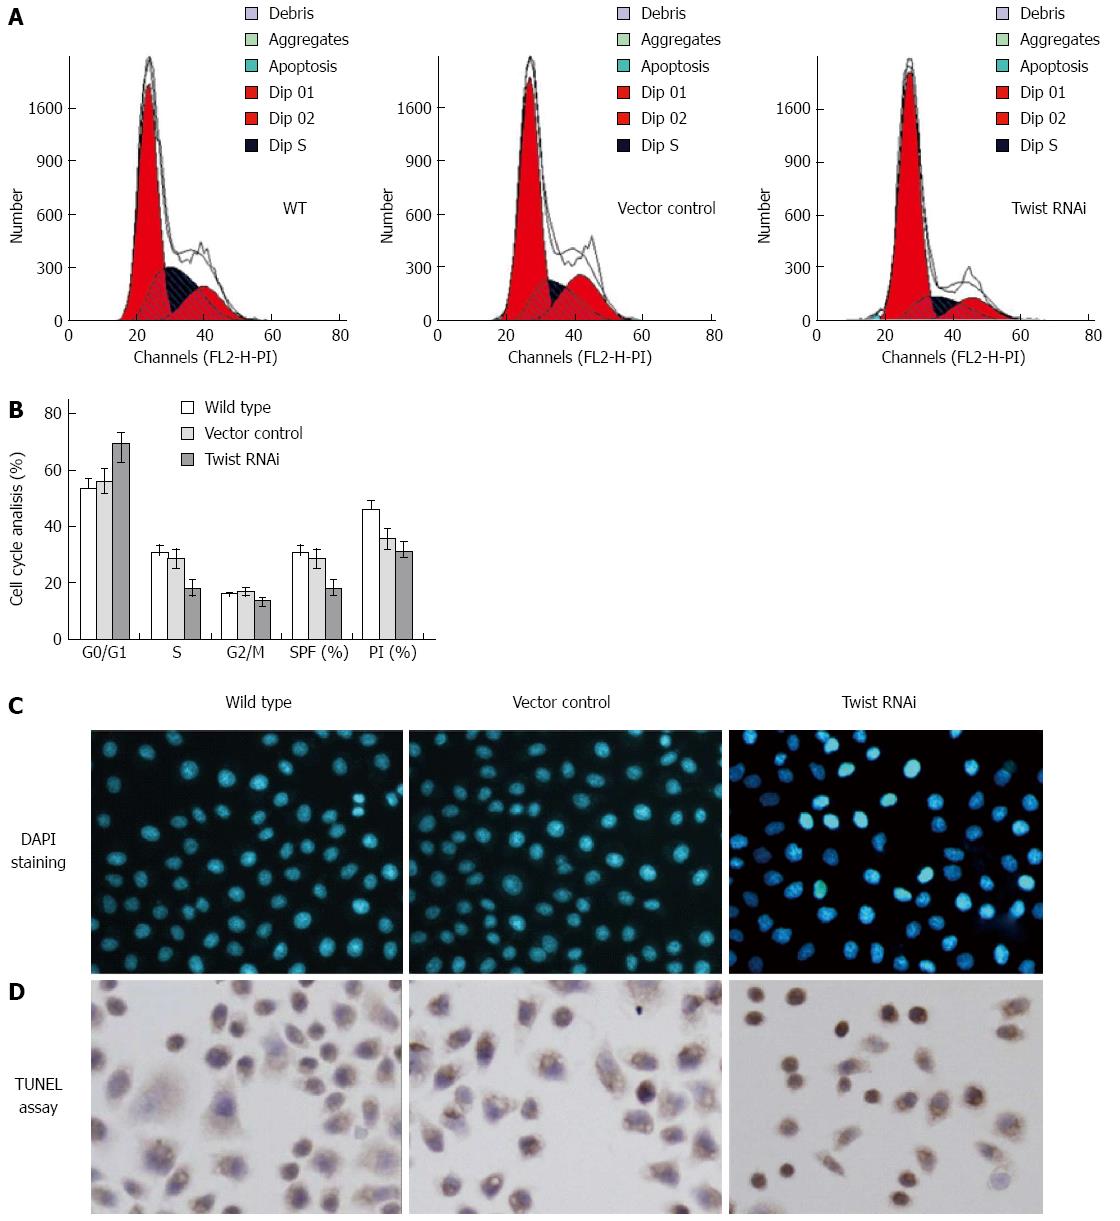
Figure 3 Cell cycle arrest and apoptosis of Twist RNAi SGC-7901 cells.
A: Representative histograms of cell cycle distribution, which show the percentages of cell-gated populations in the G0/G1, S, and G2/M phases by flow cytometric analysis; B: Bar graph of cell distributions with mean values and SD calculated from triplicate independent experiments; C: Representative DAPI staining results which show homogeneous staining of nuclei in control cells and irregular staining with small highlighted bodies as a result of apoptosis in Twist RNAi cells; D: Representative photomicrographs of positive staining (dark brown) in apoptotic cell nuclei by terminal deoxynucleotidyl transferase-mediated digoxigenin-dUTP nick-end labeling (TUNEL) assay.
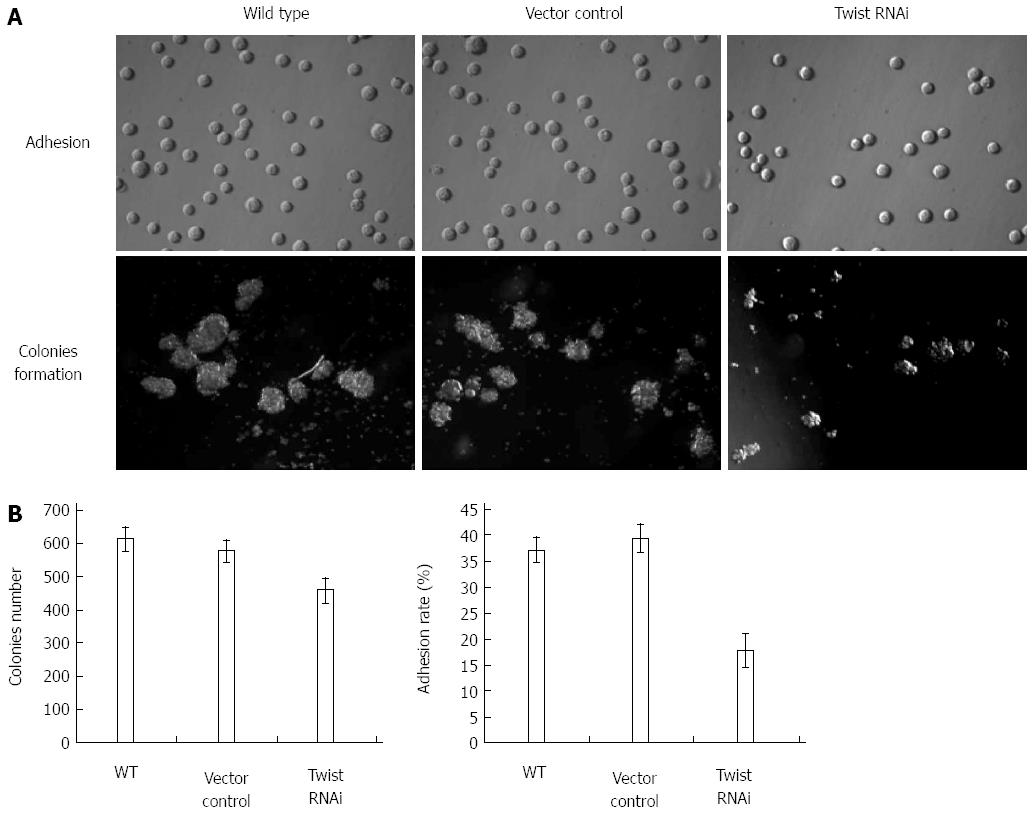
Figure 4 Twist RNAi in SGC-7901 gastric cancer cells results in poor adhesion and colony formation.
A: Images of adherent cells and colony growth in soft agar; B: The quantification of cell adhesion rate and colony formation with results presented in the form of mean ± SD.
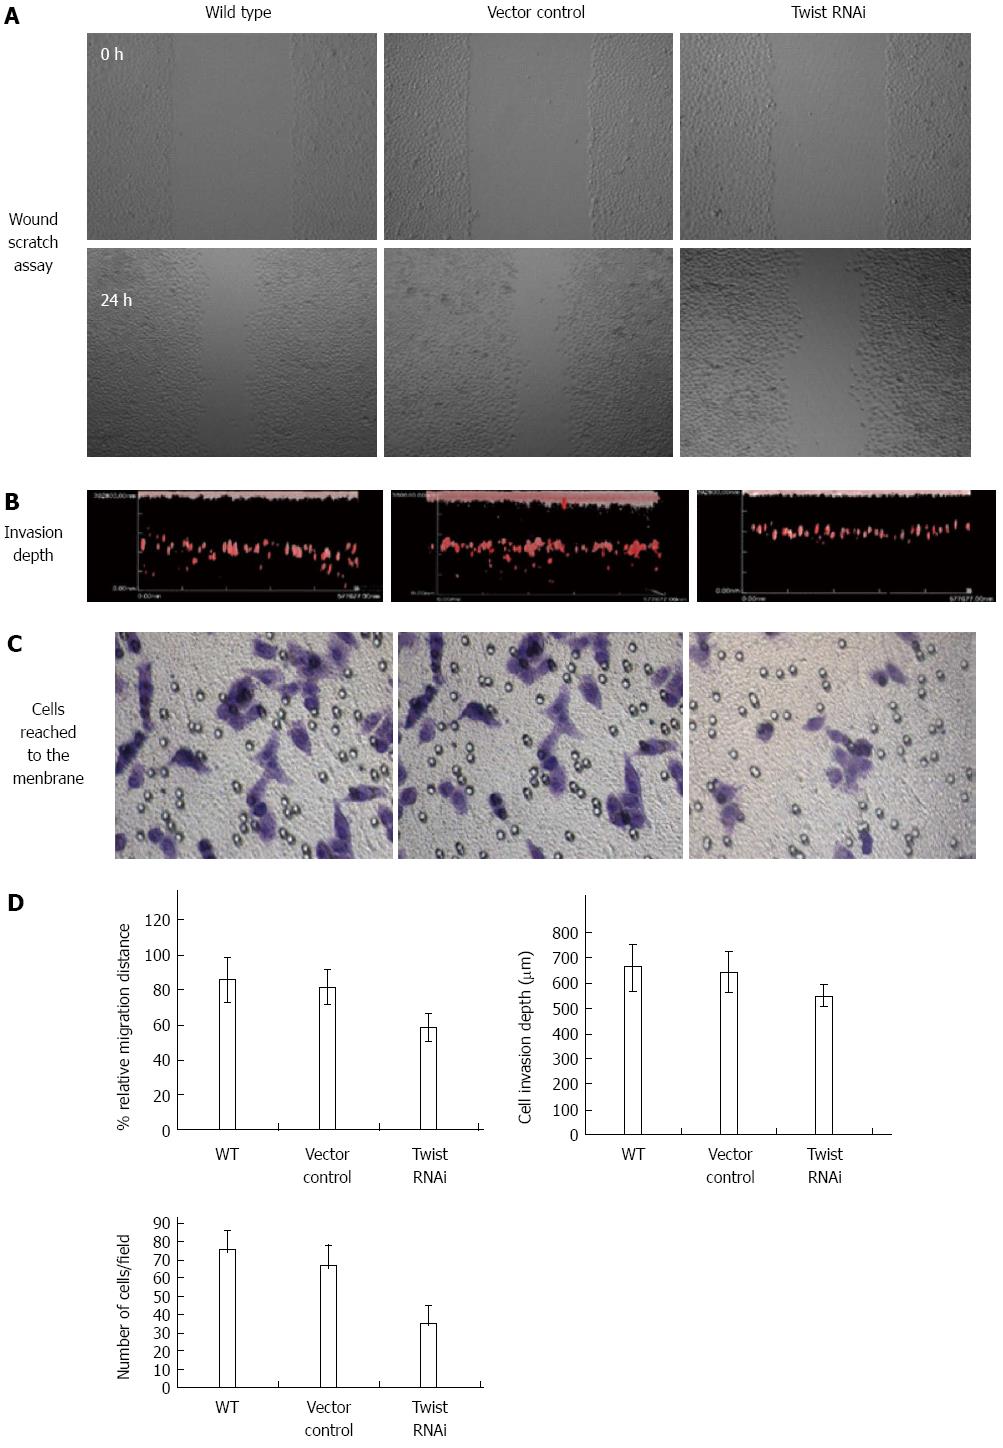
Figure 5 Reduced ability of migration and invasion for Twist RNAi SGC-7901 cells.
A: Representative view at the same place of the wound at 18 h (× 40 magnification); B: Representative view of cells penetrating the Matrigel basement membrane matrix; C: Representative view of the cells reaching the Matrigel basement membrane matrix; D: Quantitative analysis of cell migration and invasion. All the data are presented in the form of mean ± SD (bP < 0.01).
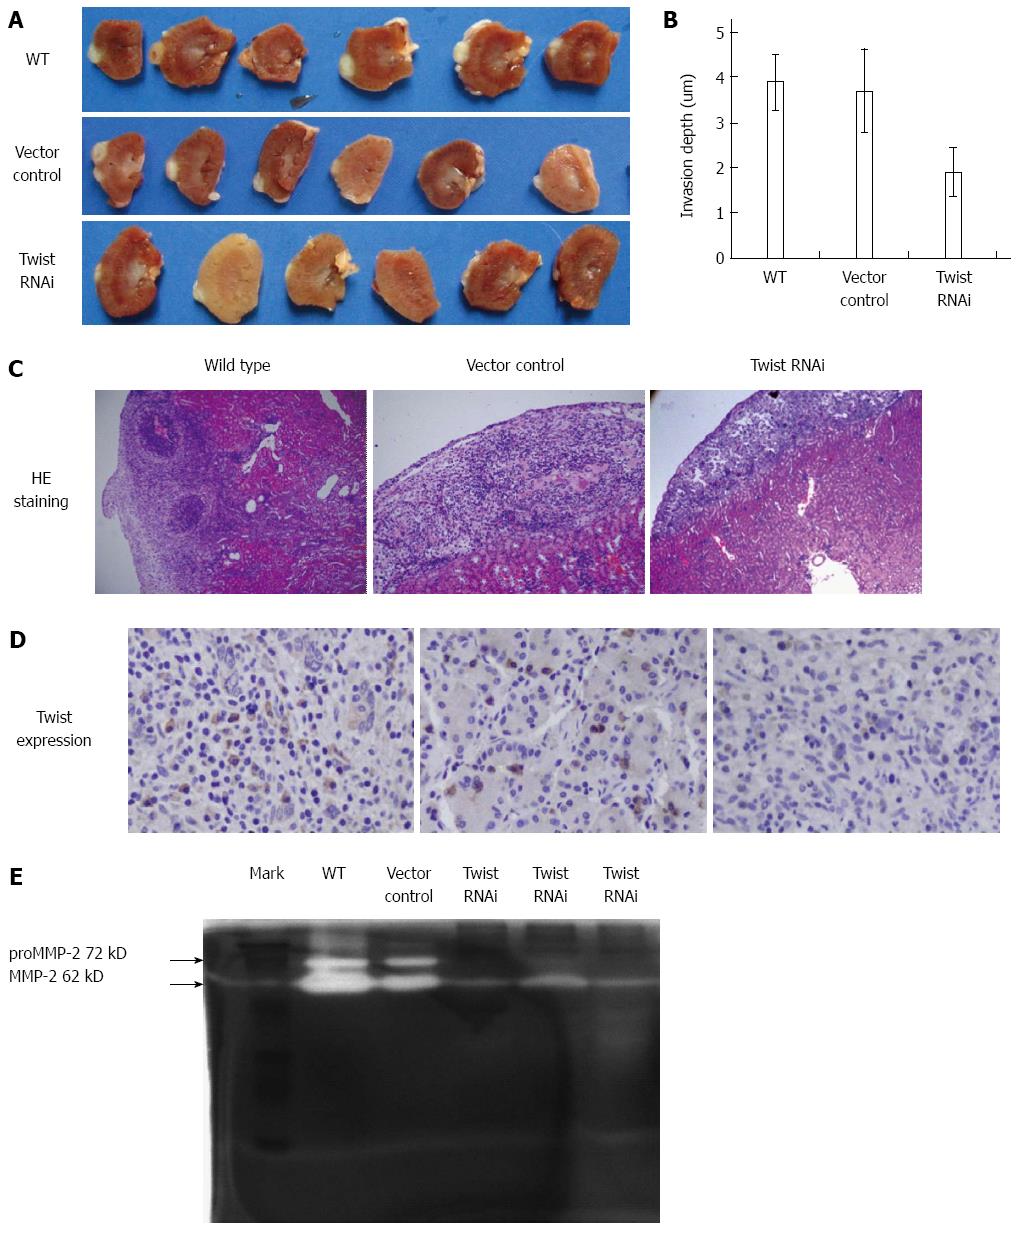
Figure 6 Effects of Twist silencing on invasive depth of SGC7901 cells in a transplanted invasion model (bP < 0.
01) (A and B); effects of Twist silencing on invasive ability by hematoxylin and eosin staining (C); expression of Twist in transplanted invasion model measured by immunohistochemistry (D); expression of matrix metalloproteinase-2 in each group measured by gelatin zymography (E).
Figure 7 Mitochondrial trans-membrane potential decreased in Twist RNAi cells measured by fluorescent activated cell sorting (FACS) (bP < 0.
01) (A); the activity of caspase-3 and -9 increased compared to the wild type and vector control (bP < 0.01 vs wild type and vector control) (B); the expression of Bax and p53 increased while the that of Bcl-2 decreased in Twist RNAi cells compared to the wild type and vector control (bP < 0.01 vs wild type and vector control) (C).
- Citation: Zhang H, Gong J, Kong D, Liu HY. Anti-proliferation effects of Twist gene silencing in gastric cancer SGC7901 cells. World J Gastroenterol 2015; 21(10): 2926-2936
- URL: https://www.wjgnet.com/1007-9327/full/v21/i10/2926.htm
- DOI: https://dx.doi.org/10.3748/wjg.v21.i10.2926


