Copyright
©2014 Baishideng Publishing Group Inc.
World J Gastroenterol. Dec 28, 2014; 20(48): 18216-18227
Published online Dec 28, 2014. doi: 10.3748/wjg.v20.i48.18216
Published online Dec 28, 2014. doi: 10.3748/wjg.v20.i48.18216
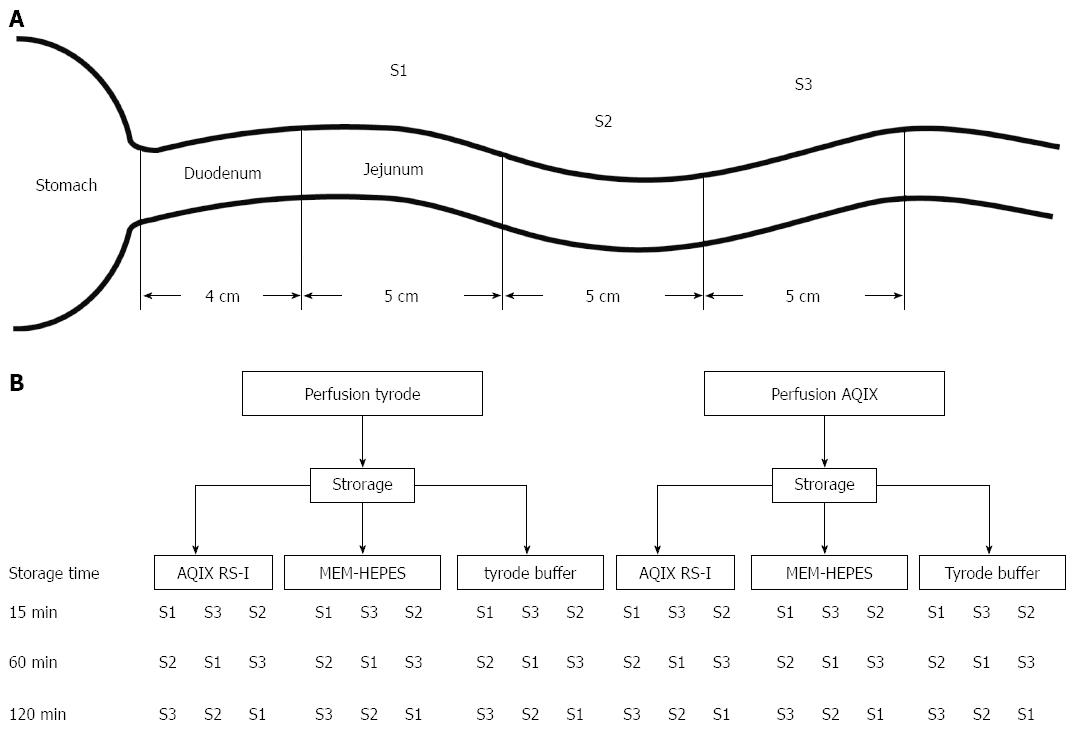
Figure 1 Perfusion schedule: Intestinal segments were used in rotating order to minimize the risk of a storage dependent bias.
A: Location of the perfused segments in vivo. Due to the recording and preparation times, the storage times were standardised at 15, 60 or 120 min; B: Order in which excised segments were stored and perfused.
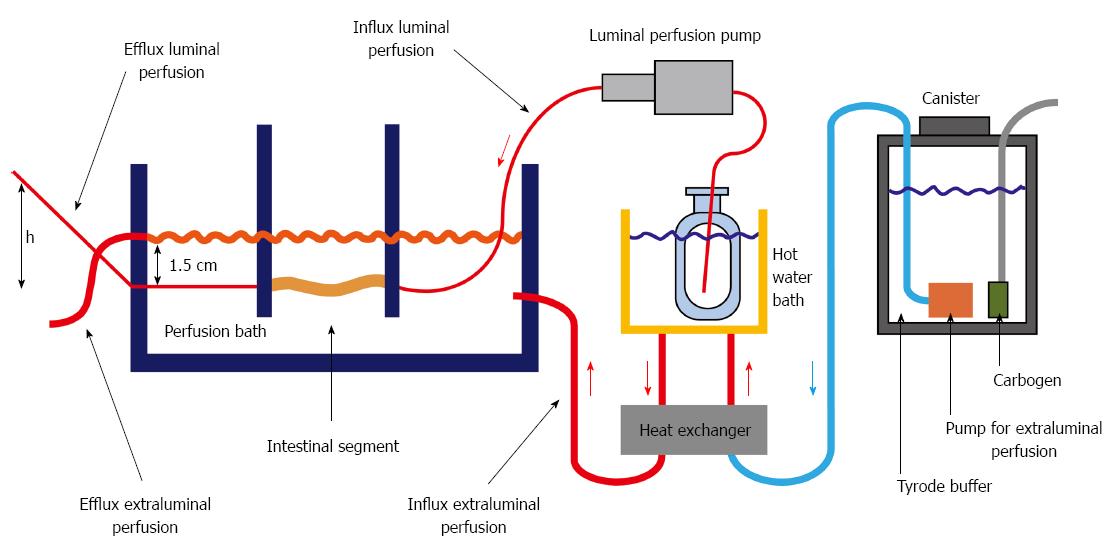
Figure 2 Perfusion setup which allows heating and pregassing the medium with carbogen.
The intestinal segment was held in place by a custom made fastener that could be regulated to hold different length segments. Luminal pressure could be individually regulated by the height of the efflux tubing.
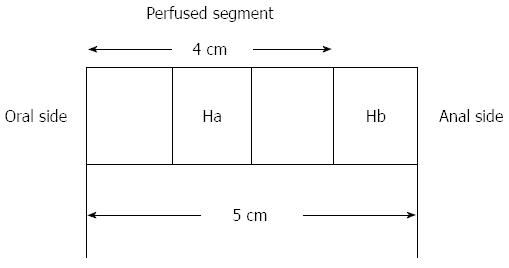
Figure 3 Histological asservation of perfused segments.
Hb is resected before perfusion and after storage in the respective medium, Ha is resected after perfusion. Hb: 1 cm-sample of the distal part of each individual segment; Ha: An equivalent piece of tissue.
Figure 4 Different motility patterns as presented in heatmaps after processing the raw video data.
A correlation between gut diameter and colour used can be seen in the legend on the right hand side. Graphic drawings on top of the individual heatmap do represent the intestinal movements seen in the heatmap images. The distension of the wavefront is marked in image (B), (D) and (F). Measuring point 32 represents the oral side, measuring point 0 the anal side of the intestinal segment. Different types of contractions could be observed A: MP1 anal direction; B: MP1 anal direction with a broadening of the wavefront; C: MP2 oral direction; D: MP2 oral direction with a broadening of the wavefront; E: MP3 anal and oral direction; F: MP3 anal and oral direction with a broadening of the wavefront; G: Irregular pattern. MP: Motility pattern.
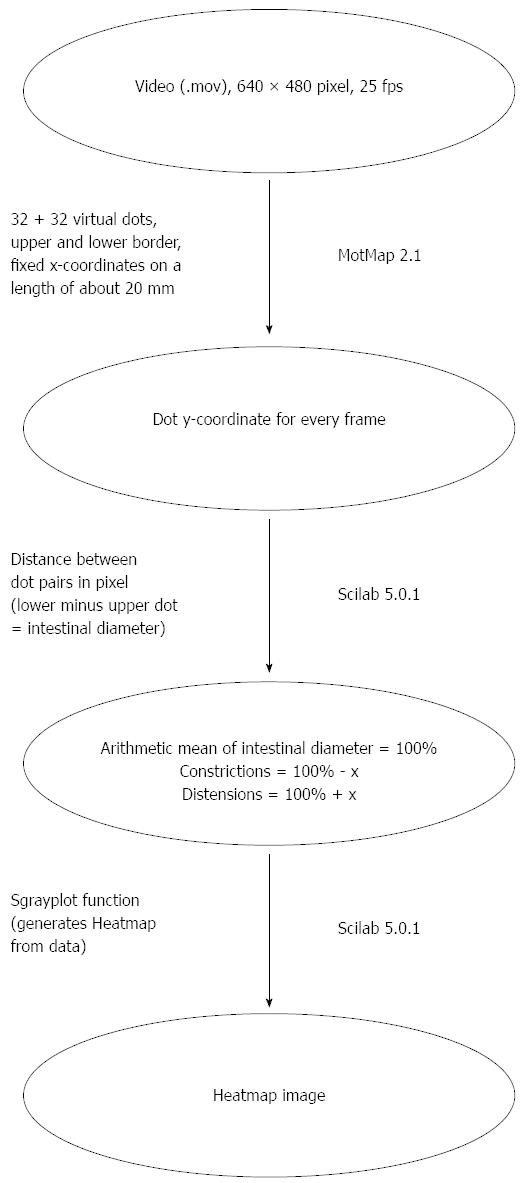
Figure 5 Diagram motility evaluation.
On the right side of the arrows, the program used for this step is shown, on the left side important parameters are indicated.
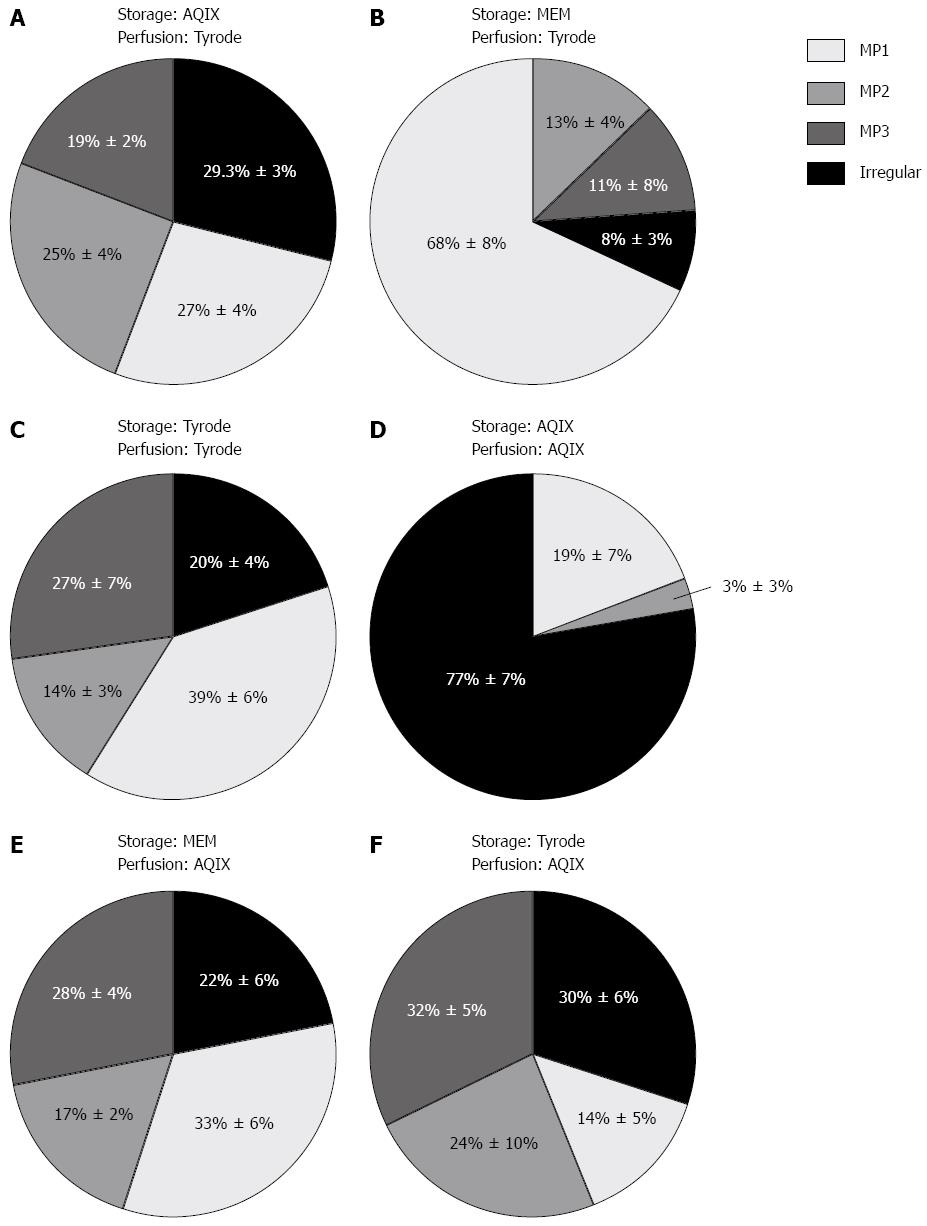
Figure 6 Motility patterns dependent on storage and perfusion medium for perfusion pressures between 4 and 9 cm of water column.
Segments were stored on ice in the storage medium and subsequently perfused in the perfusion medium. A: Storage AQIX solution, perfusion Tyrode solution; B: Storage MEM medium, perfusion Tyrode solution; C: Storage Tyrode solution, perfusion Tyrode solution; D: Storage AQIX solution, perfusion AQIX solution; E: Storage MEM medium, perfusion AQIX solution; F: Storage Tyrode solution, perfusion AQIX solution. Percentage of different motility pattern ± SE. MP: Motility pattern.
Figure 7 Motility patterns dependent on storage and perfusion medium as well as perfusion pressure.
Segments were stored on ice in the storage medium and subsequently perfused in the perfusion medium. Each perfusion pressure setting was applied for three min. In the following, perfusion pressure was increased by one cm of water column. A: Storage AQIX solution, perfusion Tyrode solution; B: Storage MEM medium, perfusion Tyrode solution; C: Storage Tyrode solution, perfusion Tyrode solution; D: Storage AQIX solution, perfusion AQIX solution; E: Storage MEM medium, perfusion AQIX solution; F: storage Tyrode solution, perfusion AQIX solution. MP: Motility pattern.
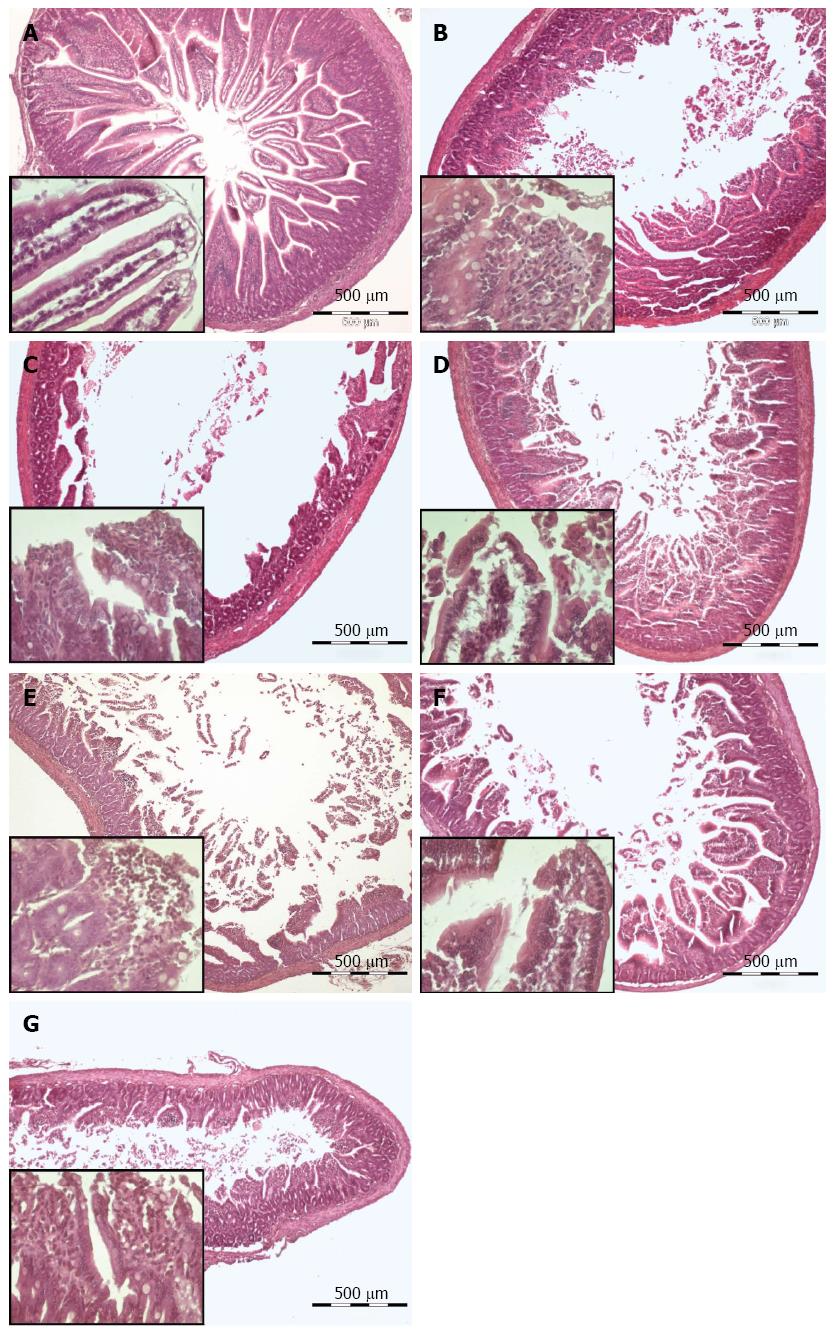
Figure 8 Effect of AQIX, MEM-HEPES and Tyrode solution (Hematoxylin-Eosin staining).
A, B, D, F after storage in the respective solution; C, E,G a cuff of the same segment after perfusion with the same solution. In the lower left quarter of each picture the mucosal structure is shown in detail. A: Unperfused tissue; B: Stored in Tyrode solution; C: Stored and perfused with Tyrode solution; D: Stored in MEM-Hepes medium; E: Stored and perfused with MEM-Hepes medium; F: Stored in AQIX RS-I solution; G: Stored and perfused with AQIX RS-I solution.
-
Citation: Schreiber D, Jost V, Bischof M, Seebach K, Lammers WJ, Douglas R, Schäfer KH. Motility patterns of
ex vivo intestine segments depend on perfusion mode. World J Gastroenterol 2014; 20(48): 18216-18227 - URL: https://www.wjgnet.com/1007-9327/full/v20/i48/18216.htm
- DOI: https://dx.doi.org/10.3748/wjg.v20.i48.18216


