Copyright
©2014 Baishideng Publishing Group Inc.
World J Gastroenterol. Nov 21, 2014; 20(43): 16334-16342
Published online Nov 21, 2014. doi: 10.3748/wjg.v20.i43.16334
Published online Nov 21, 2014. doi: 10.3748/wjg.v20.i43.16334
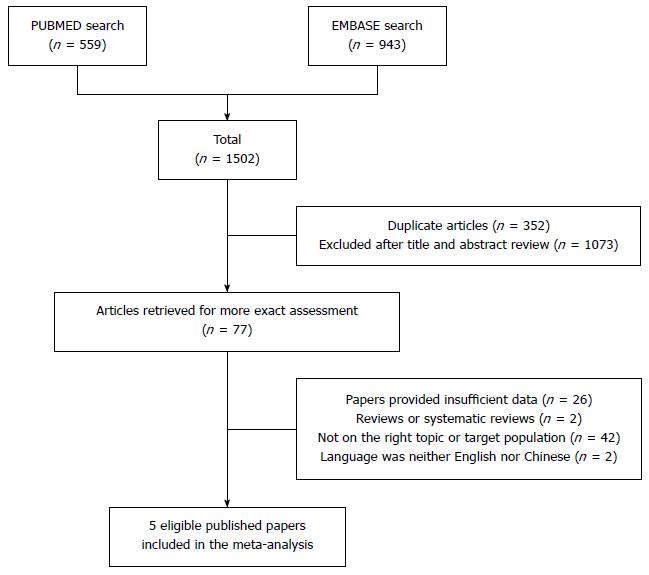
Figure 1 Flow diagram of the study selection process.
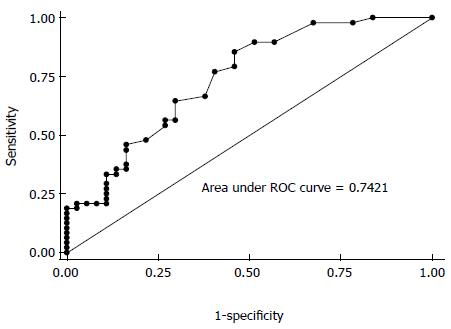
Figure 2 Area under the receiver operating characteristic curve value of interleukin-8 in colorectal cancer from the original study.
ROC: Receiver operating characteristic.
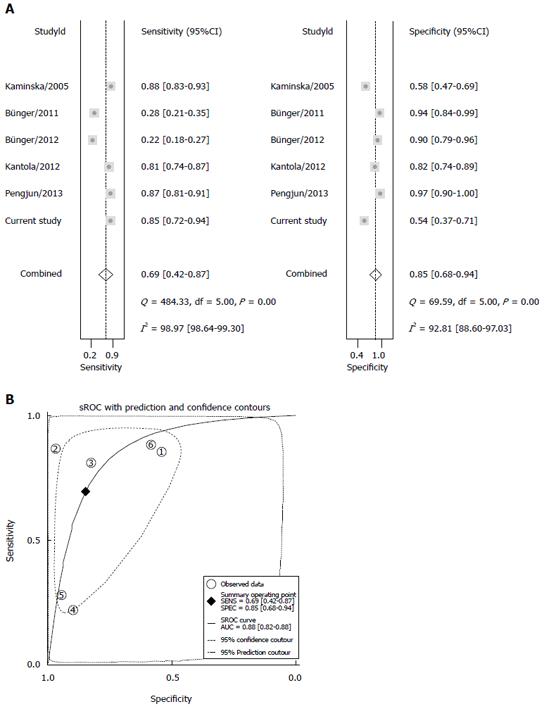
Figure 3 Diagnostic performance of interleukin-8 in the detection of colorectal cancer.
A: Forest plots of the pooled sensitivity and specificity in CRC diagnosis; B: sROC curve analysis in CRC diagnosis. sROC: Summary receiver operating characteristic; CRC: Colorectal cancer.
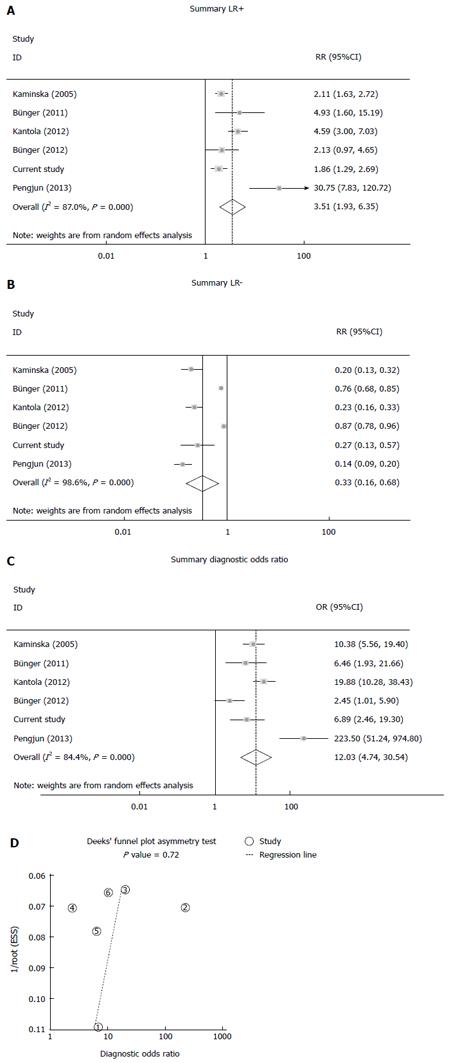
Figure 4 Positive likelihood ratio, negative likelihood ratio, diagnostic odds ratio and Deek’s funnel plot.
A: Positive LR; B: Negative LR; C: Diagnostic OR; D: Deek’s funnel plot asymmetry test. LR: Likelihood ratio; OR: Odds ratio.
- Citation: Jin WJ, Xu JM, Xu WL, Gu DH, Li PW. Diagnostic value of interleukin-8 in colorectal cancer: A case-control study and meta-analysis. World J Gastroenterol 2014; 20(43): 16334-16342
- URL: https://www.wjgnet.com/1007-9327/full/v20/i43/16334.htm
- DOI: https://dx.doi.org/10.3748/wjg.v20.i43.16334


