Copyright
©2014 Baishideng Publishing Group Inc.
World J Gastroenterol. Nov 21, 2014; 20(43): 16227-16235
Published online Nov 21, 2014. doi: 10.3748/wjg.v20.i43.16227
Published online Nov 21, 2014. doi: 10.3748/wjg.v20.i43.16227
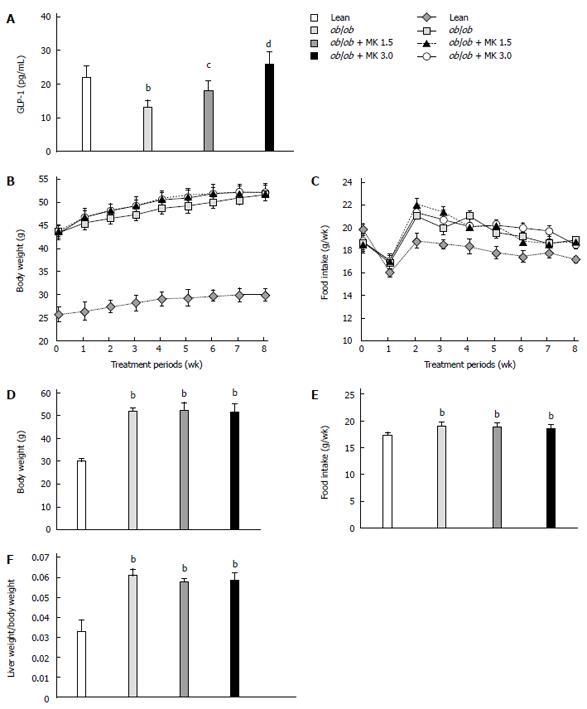
Figure 1 Serum active glucagon-like peptide-1 concentrations, body weight, food intake or ratio of liver weight to body weight in ob/ob mice and their lean littermates.
A: Serum active glucagon-like peptide-1 (GLP-1) concentrations (pg/mL) in ob/ob mice that were fed either a normal chow diet (ob/ob) or a normal chow diet supplemented with MK-0626 (1.5 mg/kg) (ob/ob + MK 1.5) or MK-0626 (3 mg/kg) (ob/ob + MK 3.0) and their lean littermates fed a normal chow diet (lean). Serum samples were collected at the end of the 8-wk treatment period; B: Changes in body weight in lean, ob/ob, ob/ob + MK 1.5 and ob/ob + MK 3.0 groups during the treatment; C: Changes in food intake in lean, ob/ob, ob/ob + MK 1.5 and ob/ob + MK 3.0 groups during the treatment; D: A comparison of body weight at the end of the 8-wk treatment period; E: A comparison of food intake at the end of the 8-wk treatment period; F: A comparison of the ratio of liver weight to body weight at the end of the 8-wk treatment period. bP < 0.01 vs the lean group; cP < 0.05, dP < 0.01 vs the ob/ob group (n = 16 mice per group).
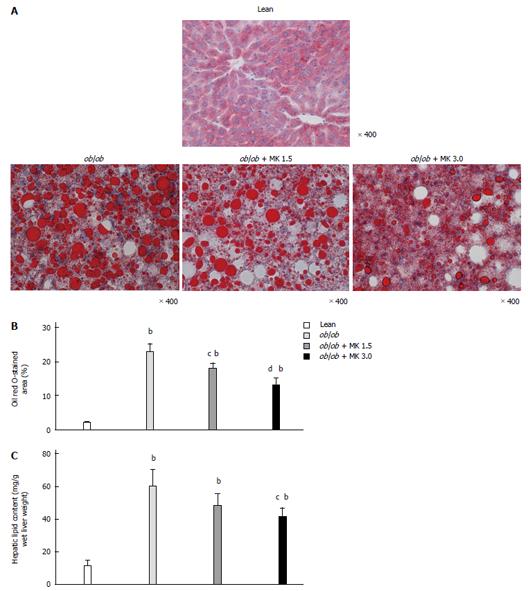
Figure 2 Assessment of hepatic histology and lipid content in the livers of ob/ob mice and their lean littermates at the end of an 8-wk treatment period.
The groups are the same as those shown in Figure 1; A: Representative hepatic histology of lean, ob/ob, ob/ob + MK 1.5 and ob/ob + MK 3.0 groups. Liver sections were stained with Oil red O; B: Quantitative histomorphometric analysis for total lipid content of all hepatic histology for each experimental group. Oil red O-stained areas were quantified in 10 microscopic fields at a 400-fold magnification; C: Quantification of the lipid content of the liver from each experimental group. Results are expressed as the mean ± SD; n =16 for each group. bP < 0.01 vs the lean group; cP < 0.05, dP < 0.01 vs the ob/ob group.
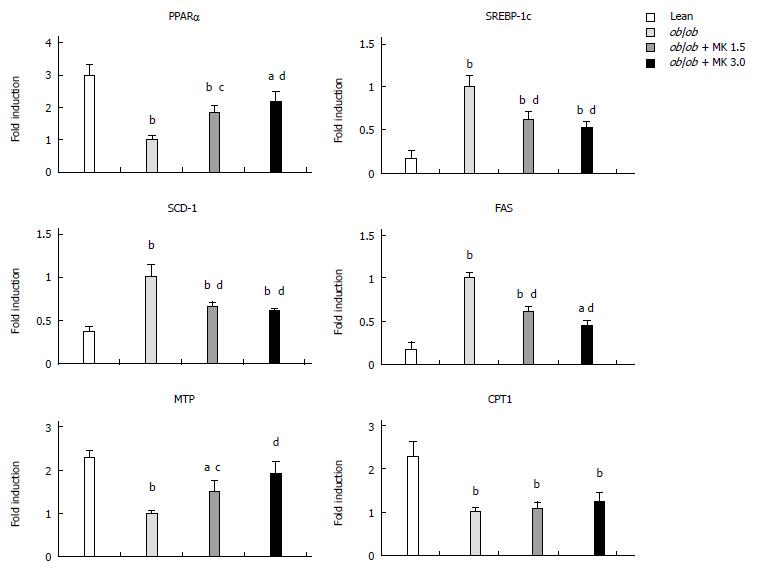
Figure 3 Effect of MK-0626 on the mRNA expression of genes related to hepatic fatty acid metabolism from whole livers at the end of the 8-wk treatment period in each experimental group.
The groups are the same as those shown in Figure 1. Total RNA extracted from liver tissues was used for mRNA expression analysis of peroxisome proliferator-activated receptor (PPAR)α, sterol regulatory element binding transcription factor (SREBP)-1c, stearoyl-CoA desaturase (SCD)-1, fatty acid synthase (FAS), microsomal triglyceride transfer protein (MTP) activity and carnitine palmitoyltransferase (CPT)-1. Results are expressed as the mean ± SD; n = 16 for each group. aP < 0.05, bP < 0.01 vs the lean group; cP < 0.05, dP < 0.01 vs the ob/ob group.
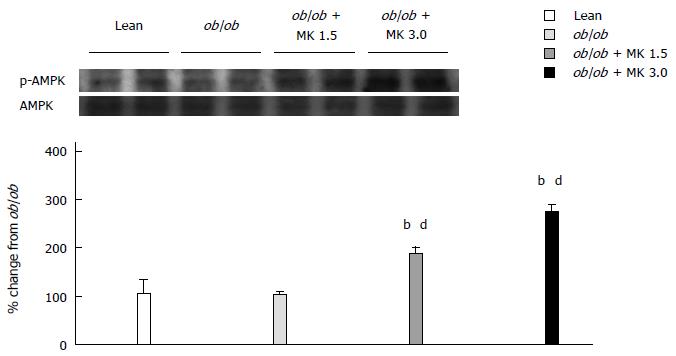
Figure 4 Phosphorylation of AMP-activated protein kinase following MK-0626 treatment in whole livers from each experimental group.
The groups are the same as those shown in Figure 1. A representative western blot shows phosphorylation of AMP-activated protein kinase (AMPK) at the end of the 8-wk treatment period. The histogram below shows the expression of p-AMPK normalized to AMPK. Results are expressed as the mean ± SD; n = 16 for each group. bP < 0.01 vs the lean group; dP < 0.01 vs the ob/ob group.
-
Citation: Ohyama T, Sato K, Yamazaki Y, Hashizume H, Horiguchi N, Kakizaki S, Mori M, Kusano M, Yamada M. MK-0626, a selective DPP-4 inhibitor, attenuates hepatic steatosis in
ob/ob mice. World J Gastroenterol 2014; 20(43): 16227-16235 - URL: https://www.wjgnet.com/1007-9327/full/v20/i43/16227.htm
- DOI: https://dx.doi.org/10.3748/wjg.v20.i43.16227


