Copyright
©2014 Baishideng Publishing Group Inc.
World J Gastroenterol. Nov 7, 2014; 20(41): 15343-15350
Published online Nov 7, 2014. doi: 10.3748/wjg.v20.i41.15343
Published online Nov 7, 2014. doi: 10.3748/wjg.v20.i41.15343
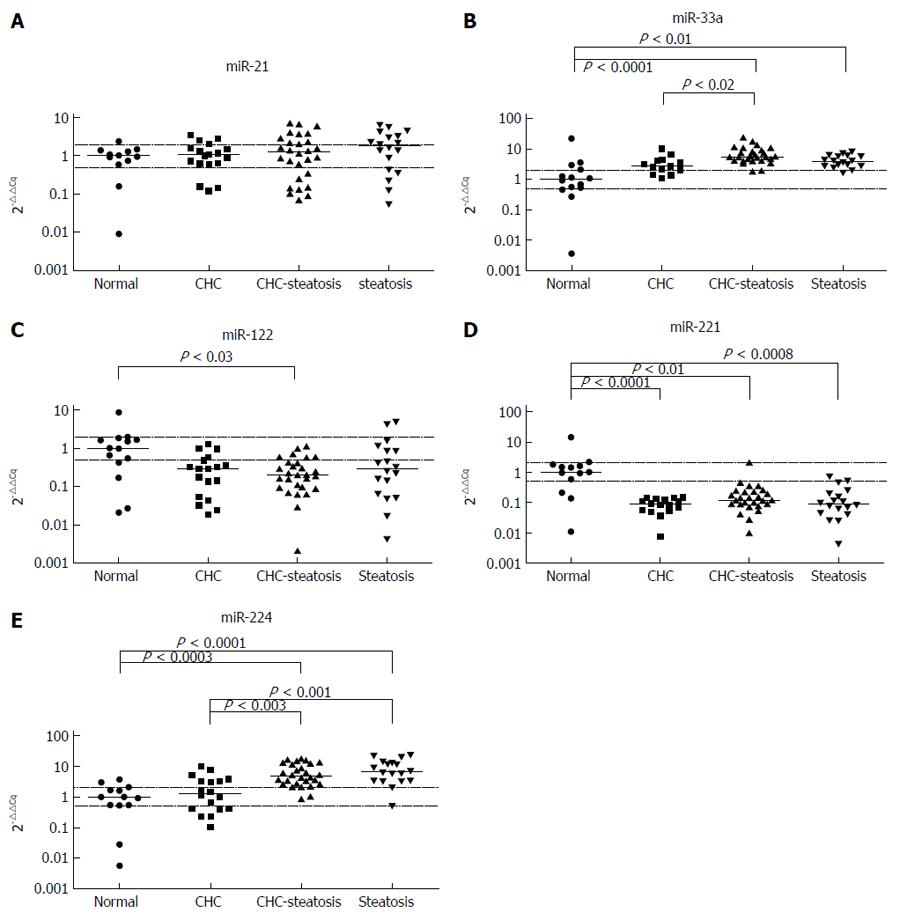
Figure 1 Normalized microRNA expression levels detected in liver samples.
The horizontal lines indicate the median of the data set. The displayed P values are the results of Kruskal-Wallis ANOVA test. The upper dotted line indicates two-fold expressional elevation, the lower dotted line signifies a one-half reduction in expression. CHC: Chronic hepatitis C; CHC-steatosis: Steatotic Chronic hepatitis C.
- Citation: Lendvai G, Jármay K, Karácsony G, Halász T, Kovalszky I, Baghy K, Wittmann T, Schaff Z, Kiss A. Elevated miR-33a and miR-224 in steatotic chronic hepatitis C liver biopsies. World J Gastroenterol 2014; 20(41): 15343-15350
- URL: https://www.wjgnet.com/1007-9327/full/v20/i41/15343.htm
- DOI: https://dx.doi.org/10.3748/wjg.v20.i41.15343


