Copyright
©2014 Baishideng Publishing Group Inc.
World J Gastroenterol. Aug 28, 2014; 20(32): 11356-11362
Published online Aug 28, 2014. doi: 10.3748/wjg.v20.i32.11356
Published online Aug 28, 2014. doi: 10.3748/wjg.v20.i32.11356
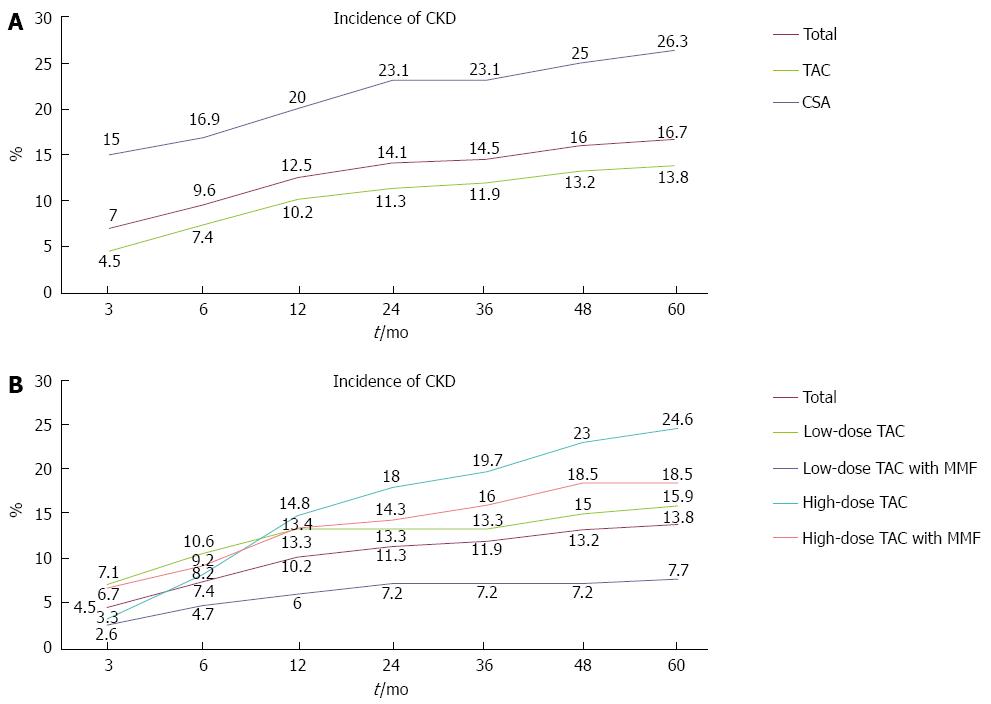
Figure 1 Incidence of chronic kidney disease.
A: Incidence of chronic kidney disease (CKD) in the tacrolimus (TAC) and cyclosporine A (CSA) groups (P < 0.05); B: Incidence of CKD in the four TAC subgroups (P < 0.05). The estimated glomerular filtration rate (eGFR) was calculated by the abbreviated modification of diet in renal disease formula after each patient visit. Once the criterion for CKD (eGFR < 60 mL/min per 1.73 m2) was met, the patient was registered in the CKD group.
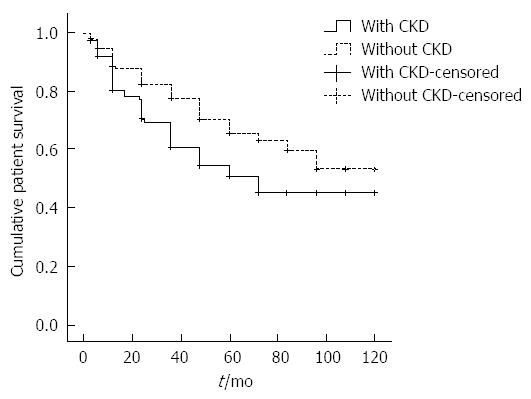
Figure 2 Kaplan-Meier analysis of cumulative patient survival in patients with and without chronic kidney disease.
The cumulative survival was significantly higher in the non-chronic kidney disease (CKD) group (log-rank test, P < 0.05).
- Citation: Hao JC, Wang WT, Yan LN, Li B, Wen TF, Yang JY, Xu MQ, Zhao JC, Wei YG. Effect of low-dose tacrolimus with mycophenolate mofetil on renal function following liver transplantation. World J Gastroenterol 2014; 20(32): 11356-11362
- URL: https://www.wjgnet.com/1007-9327/full/v20/i32/11356.htm
- DOI: https://dx.doi.org/10.3748/wjg.v20.i32.11356


