Copyright
©2014 Baishideng Publishing Group Inc.
World J Gastroenterol. Aug 28, 2014; 20(32): 11262-11272
Published online Aug 28, 2014. doi: 10.3748/wjg.v20.i32.11262
Published online Aug 28, 2014. doi: 10.3748/wjg.v20.i32.11262
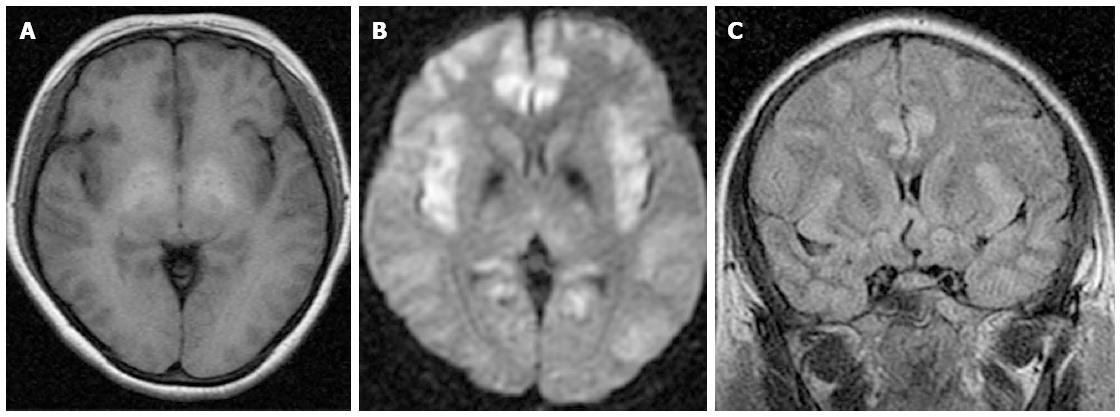
Figure 1 Acute hepatic encephalopathy in a 44-year-old female with hepatitis B virus-related cirrhosis.
A: T1 weighted image shows high signal intensity of bilateral globus pallidus; B: T2 Fluid Attenuated Inversion Recovery image shows diffused cortical edema; C: Axial diffusion weighted image shows diffuse cortical high signal intensity corresponding to diffuse cortical edema.
Figure 2 Voxel based morphometry analysis of patients with minimal hepatic encephalopathy and healthy controls.
Minimal hepatic encephalopathy patients show grey matter volume losses in the frontal and temporal cortices, caudate, putamen, amygdale, paracentral lobule, anterior and middle cingulate cortices, supplementary motor area, and increased volume in the thalamus. From reference [6] (with permission). L: Left; R: Right.
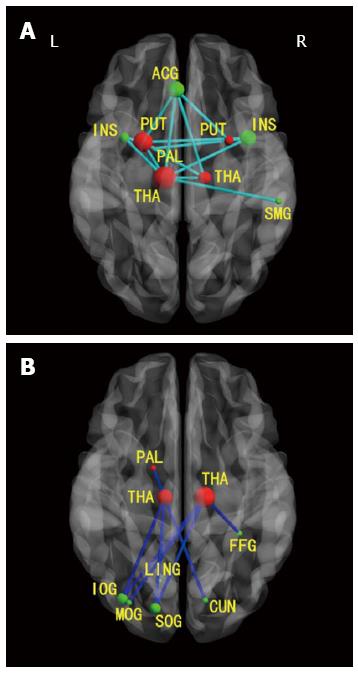
Figure 3 Axial magnetic resonance images show functional connectivities in patients with minimal hepatic encephalopathy between cortical and subcortical regions.
A: Decreased positive functional connectivities between cortical and subcortical regions; B: Decreased negative functional connectivities between cortical and subcortical regions. Green nodes: Cortical ROIs; red nodes: Subcortical ROIs; light blue lines: Decreased positive connectivities in patients with minimal HE; dark blue lines: Decreased negative connectivities in patients with minimal HE. R: Right; L: Left; ACG: Anterior cingulum gyrus; SMG: Supramarginal gyrus; PUT: Putamen; PAL: Pallidum; THA: Thalamus; CUN: Cuneus; LING: Lingual gyrus; SOG: Superior occipital gyrus; MOG: Middle occipital gyrus; IOG: Inferior occipital gyrus; FFG: Fusiform gyrus; INS: Insula. From reference [54] (with permission).
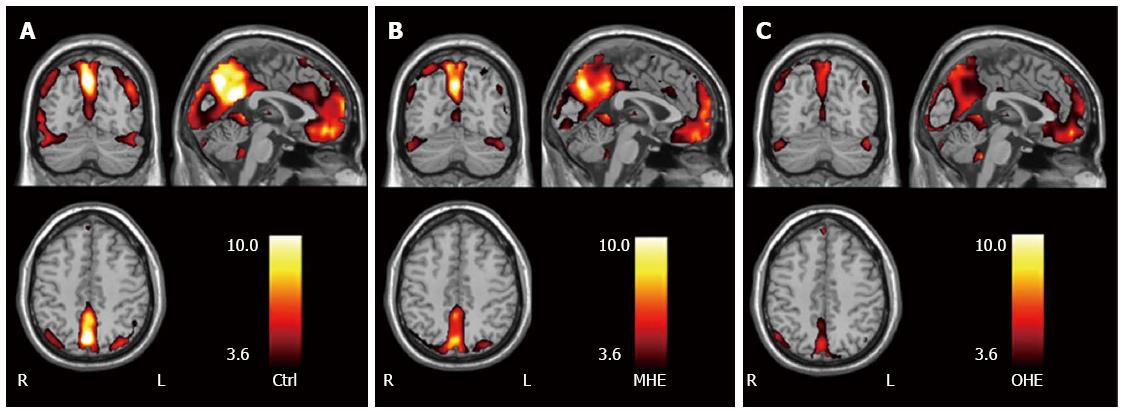
Figure 4 Amplitude of low frequency fluctuation maps in groups of healthy control subjects, patients with minimal hepatic encephalopathy, and patients with overt hepatic encephalopathy.
Group of MHE and group of OHE vs control subjects, P < 0.05. Within each group (A: Group of Ctrl; B: Group of MHE; C: Group of OHE), posterior cingulated cortex and precuneus, medial prefrontal cortex, inferior parietal lobe, and occipital areas show high amplitude of low frequency fluctuation values. Color scale indicates t values. From reference [60] (with permission). Ctrl: Control subjects; MHE: Minimal hepatic encephalopathy; OHE: Overt hepatic encephalopathy. L: Left; R: Right.
- Citation: Zhang XD, Zhang LJ, Wu SY, Lu GM. Multimodality magnetic resonance imaging in hepatic encephalopathy: An update. World J Gastroenterol 2014; 20(32): 11262-11272
- URL: https://www.wjgnet.com/1007-9327/full/v20/i32/11262.htm
- DOI: https://dx.doi.org/10.3748/wjg.v20.i32.11262


