Copyright
©2014 Baishideng Publishing Group Inc.
World J Gastroenterol. Aug 28, 2014; 20(32): 11262-11272
Published online Aug 28, 2014. doi: 10.3748/wjg.v20.i32.11262
Published online Aug 28, 2014. doi: 10.3748/wjg.v20.i32.11262
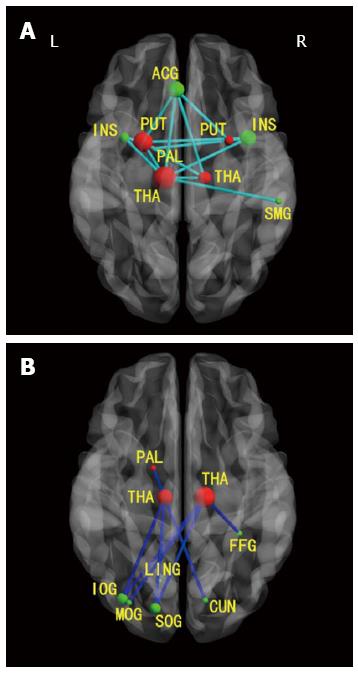
Figure 3 Axial magnetic resonance images show functional connectivities in patients with minimal hepatic encephalopathy between cortical and subcortical regions.
A: Decreased positive functional connectivities between cortical and subcortical regions; B: Decreased negative functional connectivities between cortical and subcortical regions. Green nodes: Cortical ROIs; red nodes: Subcortical ROIs; light blue lines: Decreased positive connectivities in patients with minimal HE; dark blue lines: Decreased negative connectivities in patients with minimal HE. R: Right; L: Left; ACG: Anterior cingulum gyrus; SMG: Supramarginal gyrus; PUT: Putamen; PAL: Pallidum; THA: Thalamus; CUN: Cuneus; LING: Lingual gyrus; SOG: Superior occipital gyrus; MOG: Middle occipital gyrus; IOG: Inferior occipital gyrus; FFG: Fusiform gyrus; INS: Insula. From reference [54] (with permission).
- Citation: Zhang XD, Zhang LJ, Wu SY, Lu GM. Multimodality magnetic resonance imaging in hepatic encephalopathy: An update. World J Gastroenterol 2014; 20(32): 11262-11272
- URL: https://www.wjgnet.com/1007-9327/full/v20/i32/11262.htm
- DOI: https://dx.doi.org/10.3748/wjg.v20.i32.11262


