Copyright
©2014 Baishideng Publishing Group Inc.
World J Gastroenterol. Aug 21, 2014; 20(31): 10908-10915
Published online Aug 21, 2014. doi: 10.3748/wjg.v20.i31.10908
Published online Aug 21, 2014. doi: 10.3748/wjg.v20.i31.10908
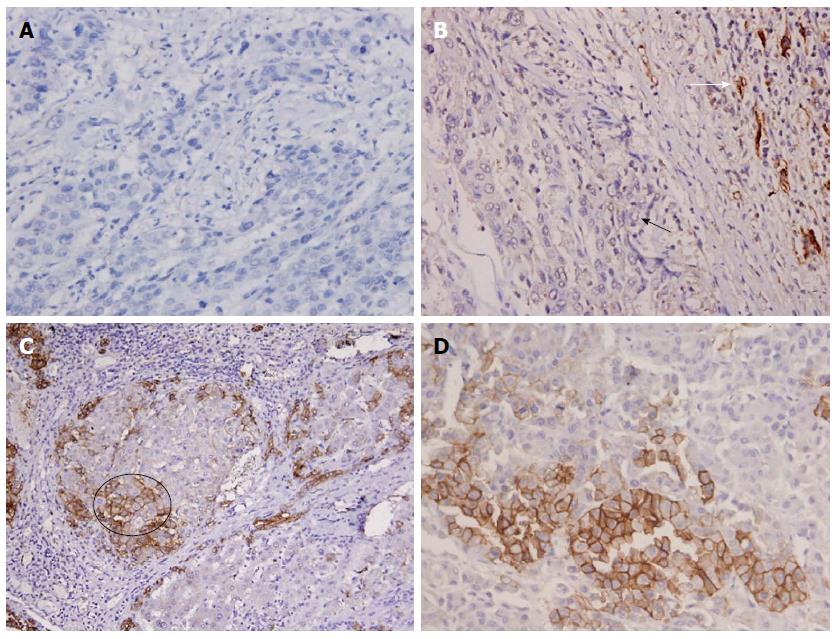
Figure 1 Immunohistochemistry staining pictures.
Diffuse loss of DR/EpCAM in HCC > 3 cm (A, IHC, × 400), a surgical sample of HCC ≤ 3 cm (a moderately differentiated HCC), and the area of foci invasion (black arrow) in HCC ≤ 3 cm; the invasive area showed diffuse loss of DR/EpCAM; but positive on the biliary cells between hepatic lobules (white arrow) (B, IHC, × 400). Active DR/EpCAM was observed in a cirrhotic nodule (C, IHC, × 200), and part of liver cells were EpCAM positive (circle). DR/EpCAM was focally positive (D, IHC, × 400), and the cells showed features of hepatocyte inside the nodules of HCCs. HCC: Hepatocellular carcinoma; DR: Ductular reaction; EpCAM: Epithelial cell adhesion molecule; IHC: Immunohistochemistry.
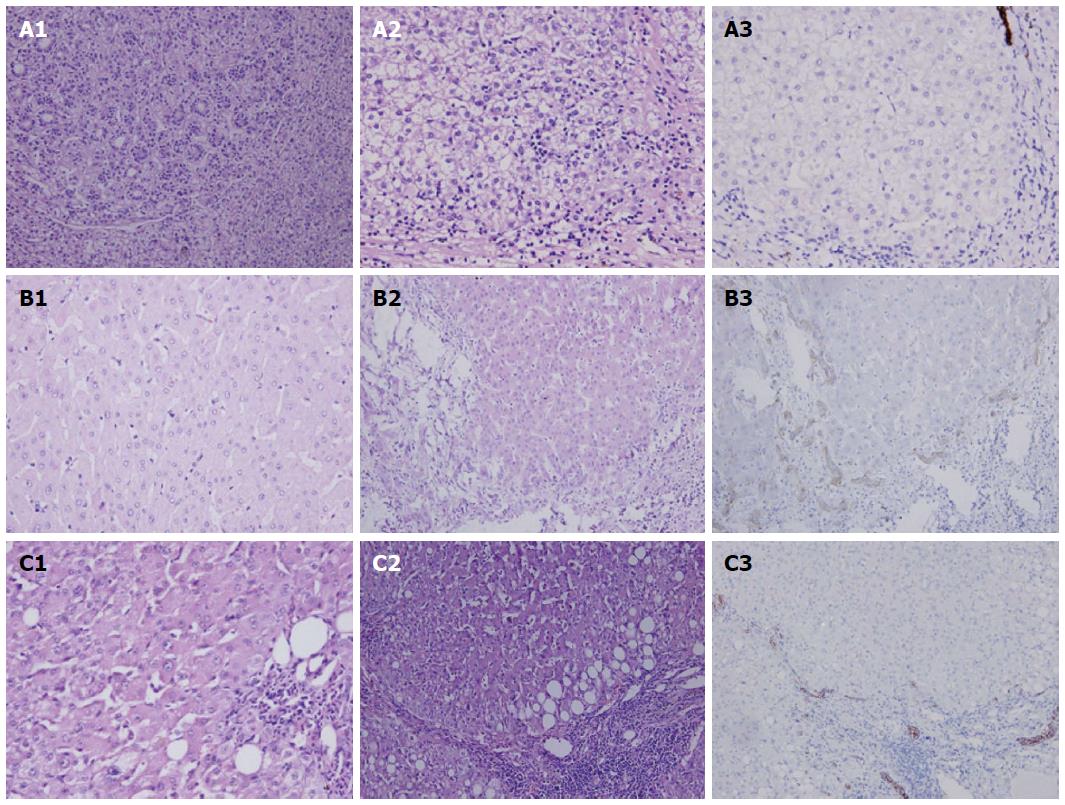
Figure 2 Immunohistochemistry and hematoxylin-eosin staining pictures.
A surgical sample of HCC ≤ 3 cm (a well-differentiated HCC), with pseudogland-like structure (A1, HE, × 200), and the features of the boundary area of the same nodule (A2, HE, × 200); this area showed diffuse loss of DR/EpCAM (A3, IHC, × 200). HGDN had an increased cell density, more than 1.5 times higher than the surrounding non-tumoral liver, often with an irregular trabecular pattern (2-3 cells thick), and small cell dysplasia (B1, HE, × 400). The cirrhotic, large regenerative nodule (CLRN) showed a mild increase in cell density with a monotonous pattern, without cytologic atypia, although they may have large cell dysplasia (C1, HE, × 400). The features of the boundary area of HGDN (B2, HE, × 200) and CLRN (C2, HE, × 200) with focal fatty change are shown respectively. Active DR/EpCAM was present in a high-grade dysplastic nodule (B3, IHC, × 200) and a CLRN (C3, IHC, × 200). HCC: Hepatocellular carcinoma; HGDN: High-grade dysplastic nodule; CLRN: Cirrhotic, large regenerative nodule; DR: Ductular reaction; EpCAM: Epithelial cell adhesion molecule; IHC: Immunohistochemistry; HE: Hematoxylin-eosin staining.
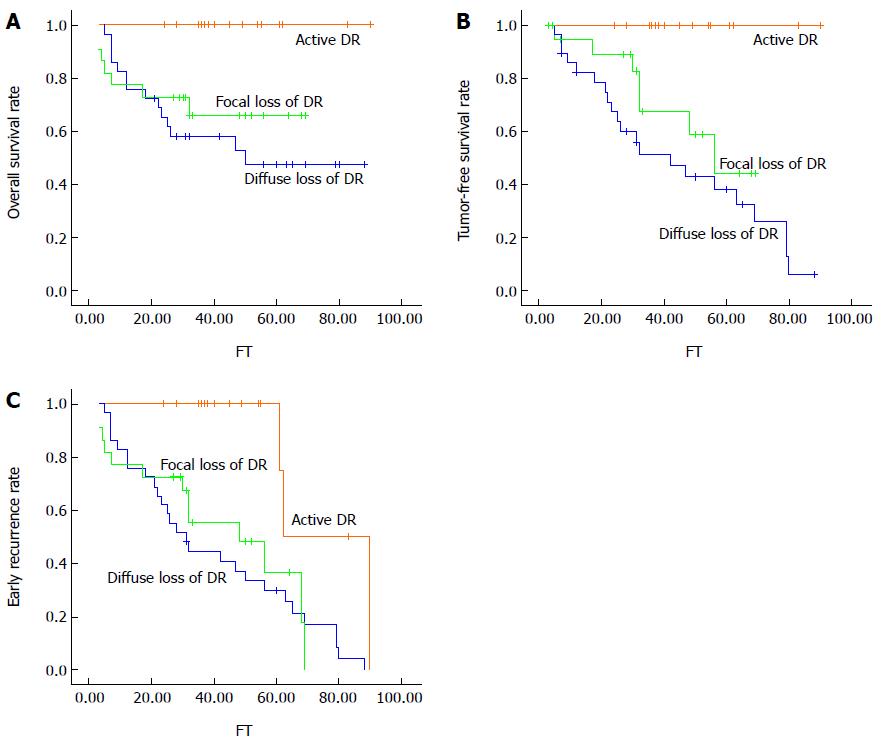
Figure 3 Survival analysis of patients with hepatocellular carcinoma ≤ 3 cm (A) and hepatocellular carcinoma with nodules > 3 cm (B) or high-grade dysplastic nodules (C).
DR: Ductular reaction; FT: Follow-up time.
- Citation: Zhang Q, Zhang CS, Xin Q, Ma Z, Liu GQ, Liu BB, Wang FM, Gao YT, Du Z. Perinodular ductular reaction/epithelial cell adhesion molecule loss in small hepatic nodules. World J Gastroenterol 2014; 20(31): 10908-10915
- URL: https://www.wjgnet.com/1007-9327/full/v20/i31/10908.htm
- DOI: https://dx.doi.org/10.3748/wjg.v20.i31.10908


