Copyright
©2014 Baishideng Publishing Group Inc.
World J Gastroenterol. Aug 7, 2014; 20(29): 10082-10093
Published online Aug 7, 2014. doi: 10.3748/wjg.v20.i29.10082
Published online Aug 7, 2014. doi: 10.3748/wjg.v20.i29.10082
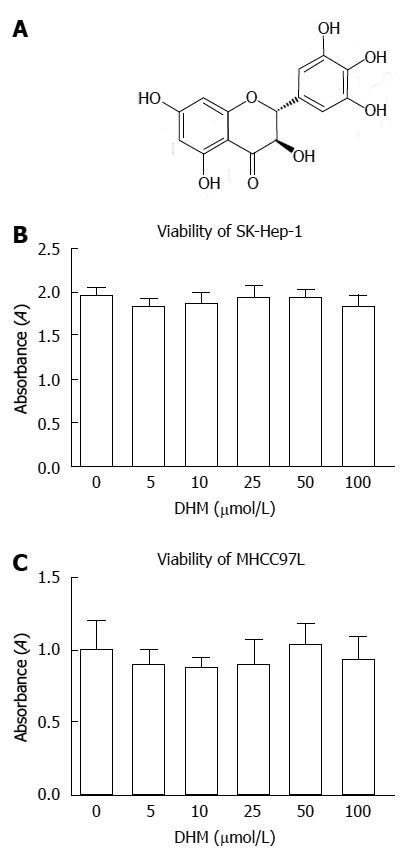
Figure 1 Chemical structure of dihydromyricetin and cell viability after dihydromyricetin treatment.
A: The chemical structure of dihydromyricetin (DHM); B, C: The effects of DHM treatment on cell viability of SK-Hep-1 (B) and MHCC97L (C) cells were tested by measuring cell proliferation. After the cells were treated with DHM in a concentration range from 0 to 100 μmol/L for 24 h, MTT assay was used to determine cell proliferation. The data showed DHM treatment at the indicated concentrations (0-100 μmol/L) did not apparently affect cell proliferation (n = 6, Student’s t test).
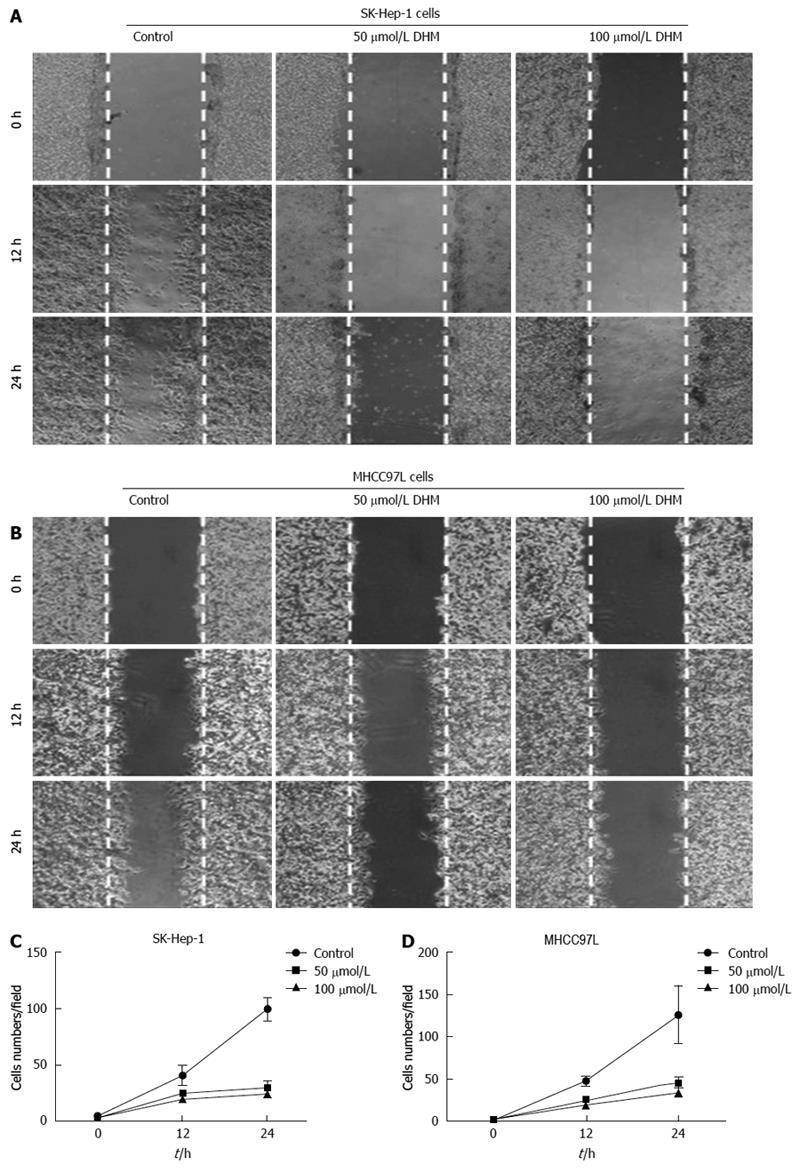
Figure 2 Effect of dihydromyricetin on wound healing in vitro.
Cell monolayers of 80%-90% confluence were scraped with a pipette tip and treated without or with 50 or 100 μmol/L dihydromyricetin (DHM) for 12 or 24 h. Wound healing was evaluated in photographs taken at the indicated time point by assaying the migration of cells into the wound. DHM treatment inhibited SK-Hep-1 (A, C) and MHCC97L (B, D) cell migration compared to the corresponding controls.
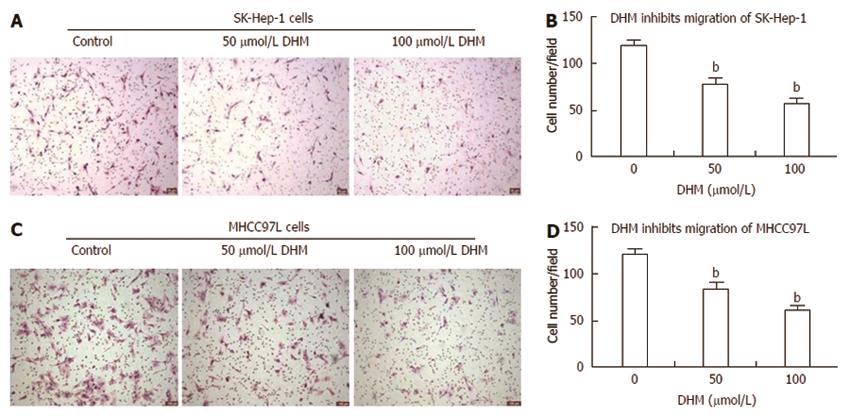
Figure 3 Dihydromyricetin inhibits cell migration in vitro.
The Boyden transwell system was used to assay cell migration as described in the ‘‘MATERIALS AND METHODS’’. SK-Hep-1 (A) and MHCC97L (C) cells that passed through polycarbonate membranes with an 8.0-μmol/L pore size were fixed in 75% ethanol and stained with hematoxylin and eosin solution. The number of SK-Hep-1 (B) and MHCC97L (D) cells that migrated through the membrane was quantified by determining the number of cells per field under an inverted microscope at 100 × magnification. Dihydromyricetin (DHM) significantly suppressed the migration of SK-Hep-1 and MHCC97L cells. Each experiment was carried out at least three times. bP < 0.01 vs control, Student’s t test.
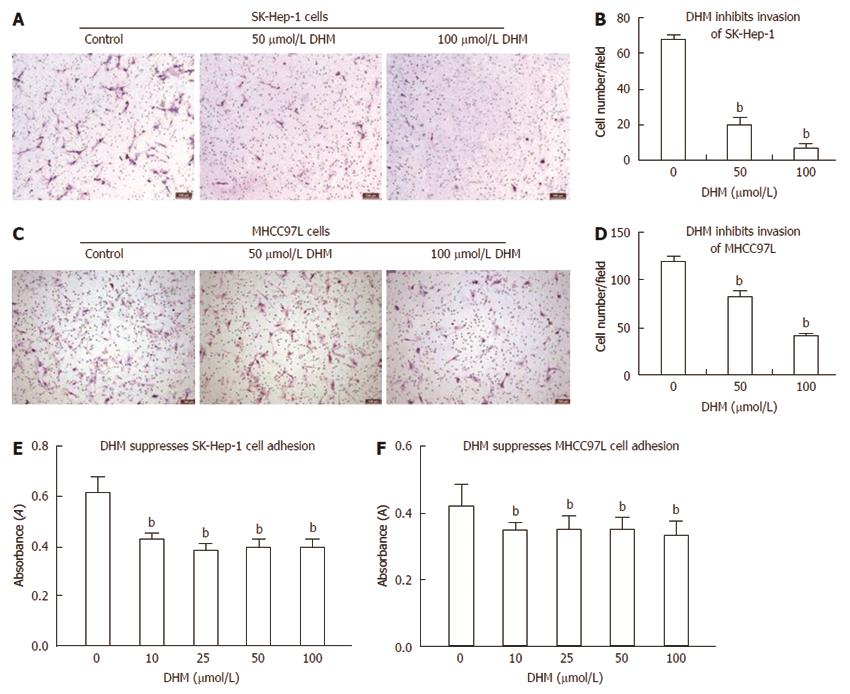
Figure 4 Dihydromyricetin inhibits cell invasion and adhesion in vitro.
Cell invasion assays were performed using a method similar to the cell motility assays, but using 8.0-μm pore size polycarbonate membranes that were pre-coated with 100 μL of Matrigel and allowed to solidify in an incubator at 37 °C for 3-4 h as described in the ‘‘MATERIALS AND METHODS’’. The SK-Hep-1 (A) and MHCC97L (C) cells that passed through the Matrigel and membrane were fixed in 75% ethanol and stained with hematoxylin and eosin solution. The number of SK-Hep-1 (B) and MHCC97L (D) cells that passed through Matrigel and membrane was quantified by determining the number of cells per field under an inverted microscope at 100 × magnification. The cells in at least four fields of each bottom of chamber were randomly photographed and counted for each assay. DHM treatment significantly inhibited the invasion of SK-Hep-1 and MHCC97L cells. Each experiment was performed at least three times. To measure the effect of DHM treatment on cell adhesion, SK-Hep-1 and MHCC97L cells were pre-treated with or without DHM at the indicated concentrations for 24 h. The cells were then resuspended in serum-free culture medium and added to 96-well plates coated with fibronectin. After incubation for 1 h, the adherent cells were measured using MTT assays. Dihydromyricetin (DHM) treatment decreased the number of SK-Hep-1 (E) and MHCC97L (F) cells adhered to fibronectin compared to the control. bP < 0.01 vs control, Student’s t test.
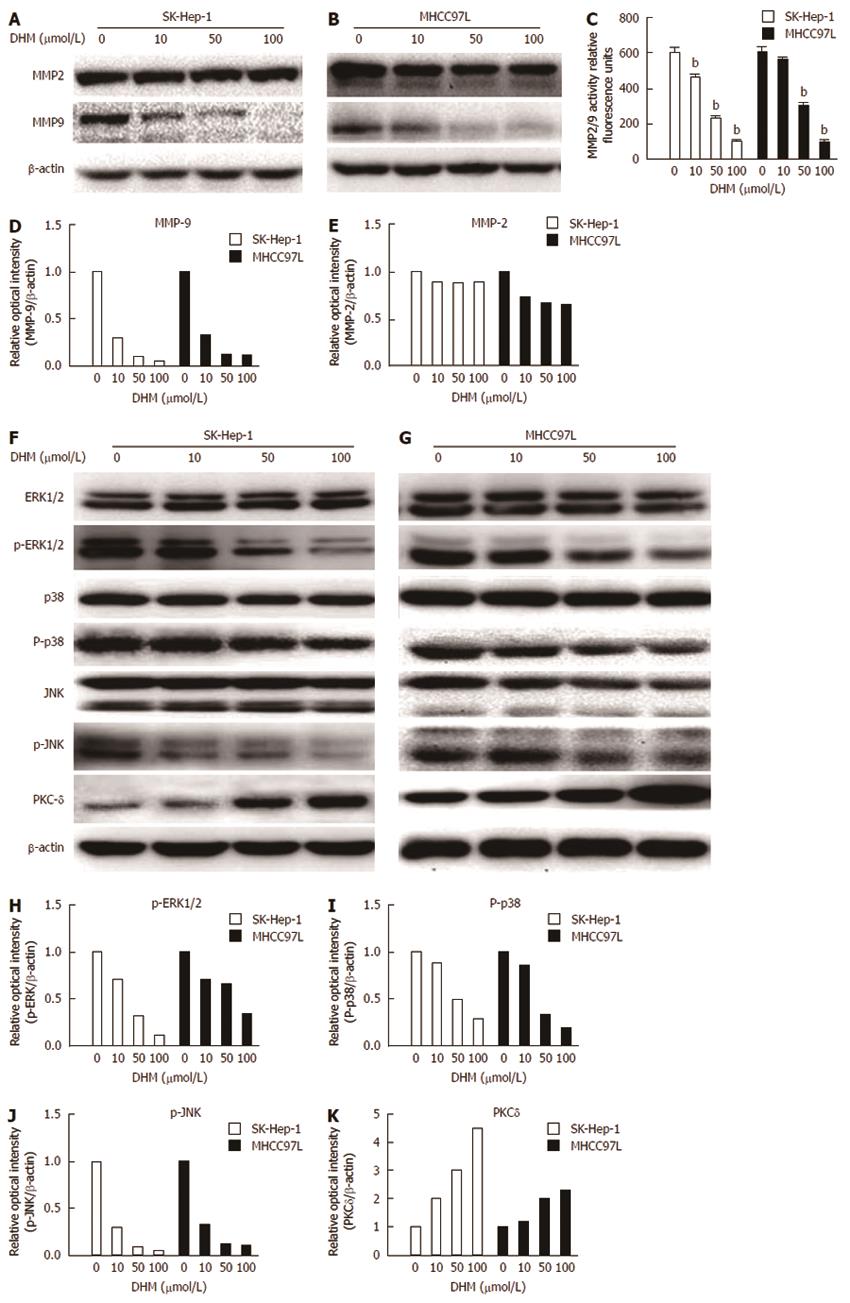
Figure 5 Effect of dihydromyricetin on matrix metalloproteinase-2/matrix metalloproteinase-9 expression and the signaling pathways upstream of matrix metalloproteinase (MMP)-9.
SK-Hep-1 and MHCC97L cells were treated with or without dihydromyricetin at the indicated concentrations for 24 h. The cells were then collected and lysed in lysis buffer. The total cell lysates were examined by Western blot. Matrix metalloproteinase (MMP)-2 and MMP-9 protein expression was detected by Western blot in SK-Hep-1 (A, D) and MHCC97 L (B, E) cells after dihydromyricetin (DHM) treatment for 24 h. MMP2/9 activity was measured by fluorescence analysis (C). The levels of ERK1/2, p38, JNK, PKC-δ, p-ERK1/2, p-p38, and p-JNK in SK-Hep-1 (F) and MHCC97L (G) cells were also measured by Western blot assays. A bicinchoninic acid (BCA) assay was used to measure the protein concentration of each sample. DHM regulated p-ERK1/2 (H), P-p38 (I), p-JNK (J) and PKC-δ (K) levels in a concentration-dependent manner. bP < 0.01 vs control, Student’s t test.
- Citation: Zhang QY, Li R, Zeng GF, Liu B, Liu J, Shu Y, Liu ZK, Qiu ZD, Wang DJ, Miao HL, Li MY, Zhu RZ. Dihydromyricetin inhibits migration and invasion of hepatoma cells through regulation of MMP-9 expression. World J Gastroenterol 2014; 20(29): 10082-10093
- URL: https://www.wjgnet.com/1007-9327/full/v20/i29/10082.htm
- DOI: https://dx.doi.org/10.3748/wjg.v20.i29.10082


