Copyright
©2014 Baishideng Publishing Group Inc.
World J Gastroenterol. Jul 28, 2014; 20(28): 9497-9505
Published online Jul 28, 2014. doi: 10.3748/wjg.v20.i28.9497
Published online Jul 28, 2014. doi: 10.3748/wjg.v20.i28.9497
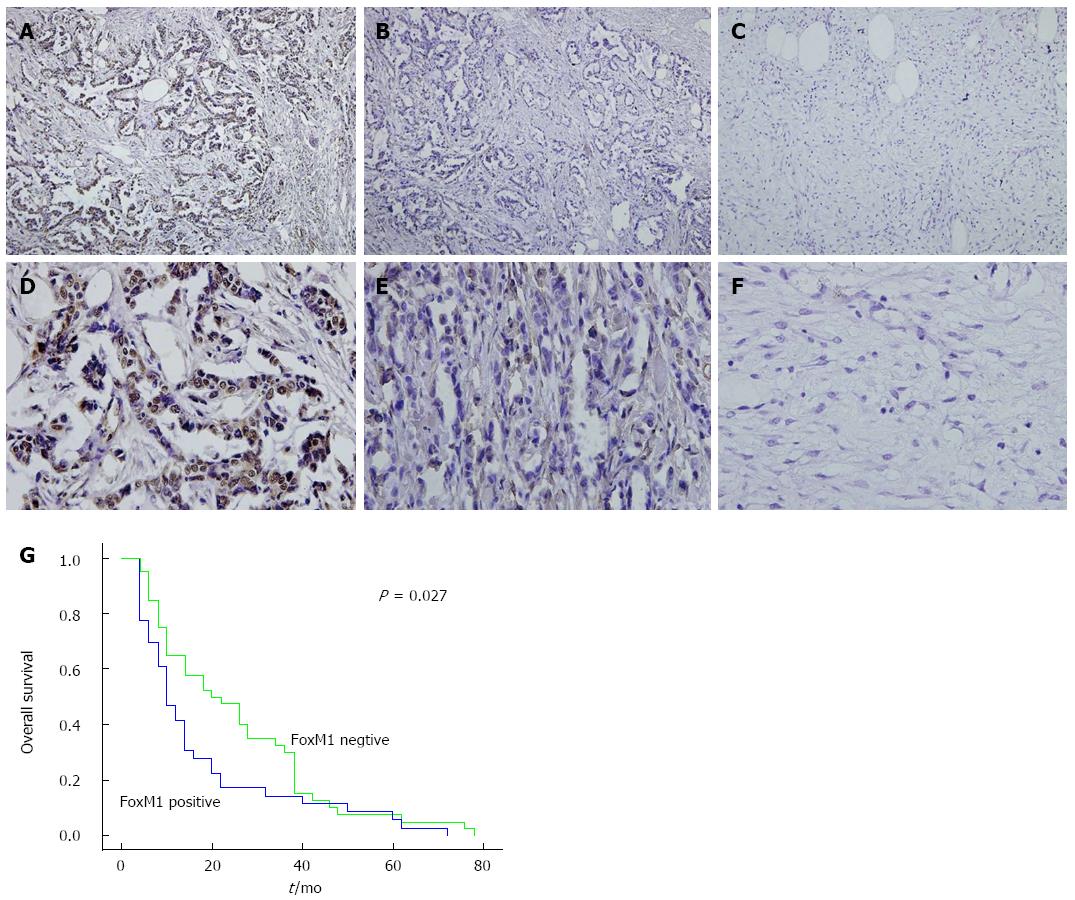
Figure 1 Immunohistochemical analysis of Forkhead box M1 in gallbladder carcinoma (A and D), pericarcinoma (B and E) and healthy tissues (C and F).
Typically, immunohistologic features showed high levels of Forkhead box M1 (FoxM1) expression in carcinoma, low levels of FoxM1 expression in pericarcinoma, and negative staining of FoxM1 in healthy gallbladder tissues. G: Kaplan-Meier analysis of the GBC patients, indicating the poorer survival of the patients with positive FoxM1 expression (P < 0.05). Original magnification (× 100, top; × 400, bottom).
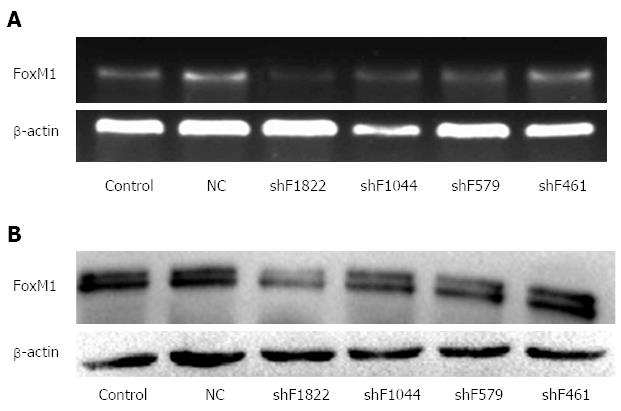
Figure 2 Expression of Forkhead box M1 in gallbladder carcinoma-SD cells transfected with different shRNAs, detected by RT-PCR (A) and Western blot (B).
Results showed that the shF1822 could significantly inhibit the expression of Forkhead box M1 (FoxM1), both at the mRNA and protein levels. Data are from three independent experiments.
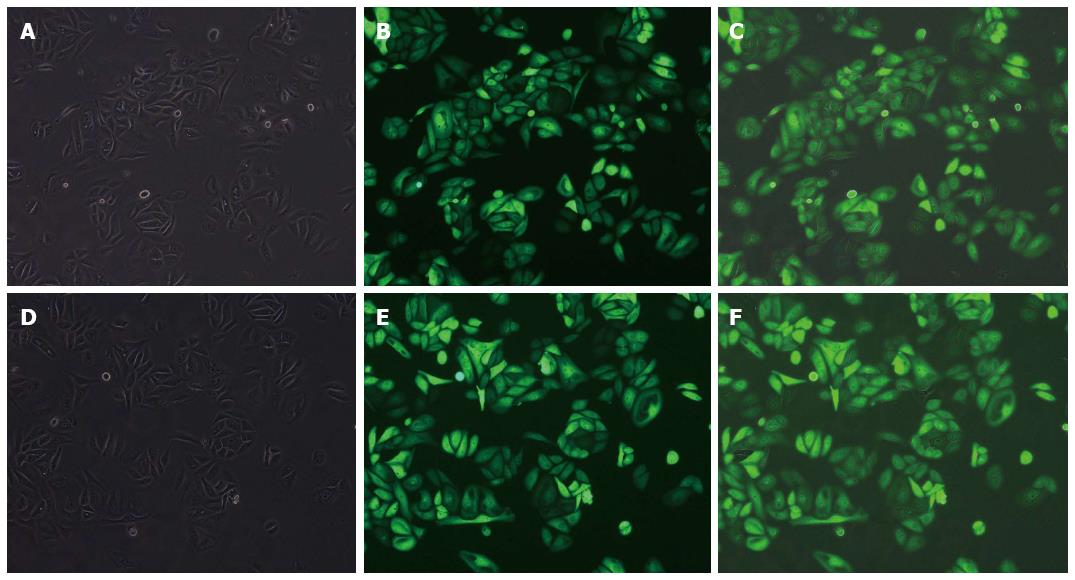
Figure 3 Representative photograph (× 100) showing recombinant adenovirus transfection efficiency evaluated by fluorescence microscopy (transfected with the negative control, top; transfected with the shF1822, bottom).
A, D: Under an ordinary light microscope; B, E: Under a fluorescence microscope; C, F: Superimposed image of the two images.
Figure 4 Expression of Forkhead box M1 in gallbladder carcinoma-SD cells transfected with the recombinant adenovirus with shF1822, detected by RT-PCR (A) and Western blot (B).
Results showed that the shF1822 could significantly inhibit the expression of Forkhead box M1 (FoxM1), both at the mRNA and protein levels. Data are from three independent experiments.
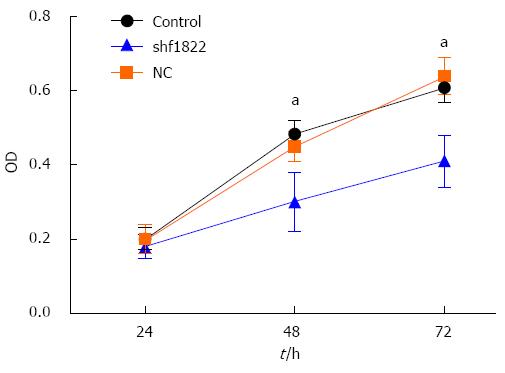
Figure 5 Down-regulation of Forkhead box M1 inhibited cell viability as revealed by MTT assay.
Compared with the control and NC groups, shF1822 significantly inhibited the proliferation of GBC-SD cells at 48 h and 72 h. Data are mean ± SD from three independent experiments. aP < 0.05 vs control.
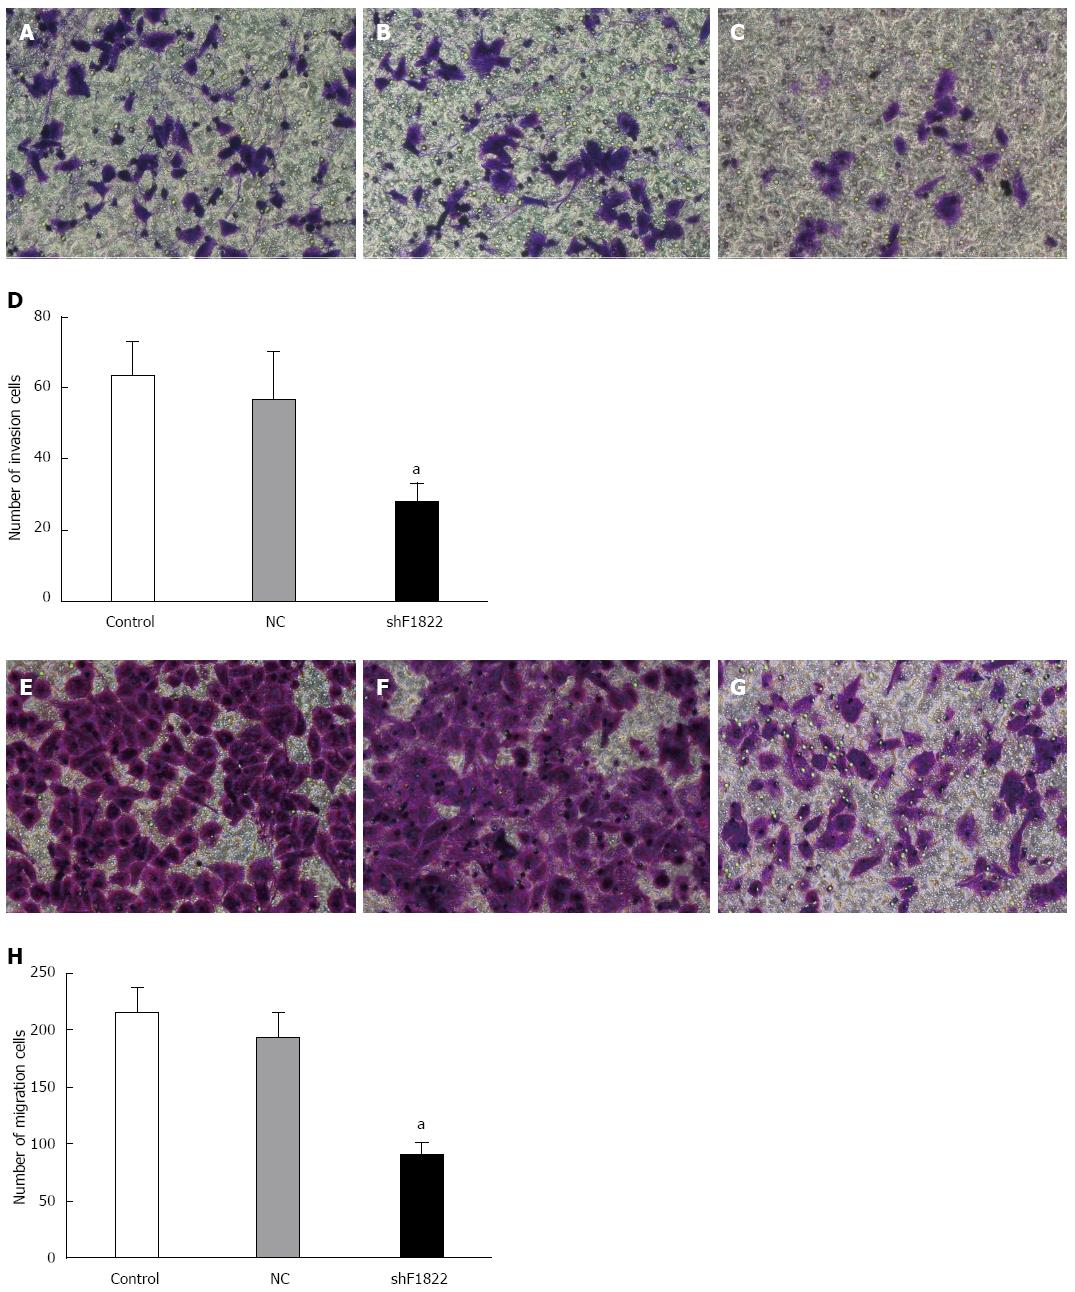
Figure 6 Down-regulation of Forkhead box M1 suppressed cell invasion and migration in gallbladder carcinoma-SD cells as measured by the Transwell cell coated or uncoated with growth factor-reduced Matrigel.
Compared with the control group (A) and NC group (B), shF1822 (C) significantly inhibited the invasion ability of gallbladder carcinoma (GBC)-SD cells; D: Cells that invaded the bottom well were counted from 10 different visual fields. Compared with the control group (E) and NC group (F), shF1822 (G) significantly inhibited the migration ability of GBC-SD cells; H: Cells that invaded the bottom well were counted from 10 different visual fields. Data are mean ± SD from three independent experiments. aP < 0.05 vs control.
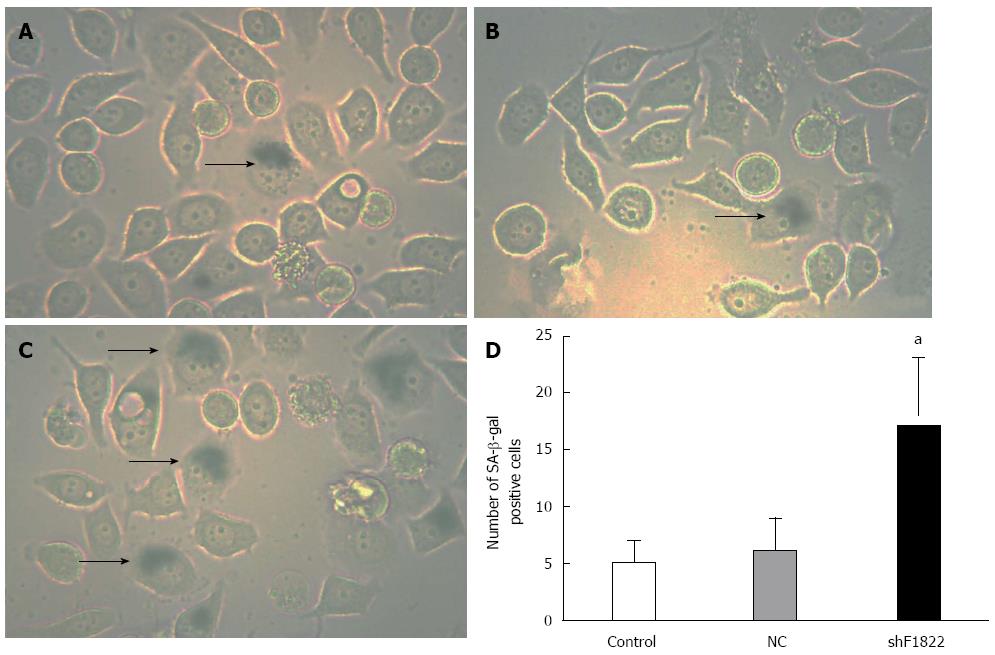
Figure 7 Senescence was induced by Forkhead box M1 down-regulation in gallbladder carcinoma-SD cells.
β-gal staining suggested that, compared with the control (A) and NC (B) groups, suppression of FoxM1 (C) induced more senescent cells in gallbladder carcinoma (P < 0.05). Data are mean ± SD from three independent experiments. Arrow: Positive SA-β-gal cells. aP < 0.05 vs control.
- Citation: Tao J, Xu XS, Song YZ, Qu K, Wu QF, Wang RT, Meng FD, Wei JC, Dong SB, Zhang YL, Tai MH, Dong YF, Wang L, Liu C. Down-regulation of FoxM1 inhibits viability and invasion of gallbladder carcinoma cells, partially dependent on inducement of cellular senescence. World J Gastroenterol 2014; 20(28): 9497-9505
- URL: https://www.wjgnet.com/1007-9327/full/v20/i28/9497.htm
- DOI: https://dx.doi.org/10.3748/wjg.v20.i28.9497


