Copyright
©2014 Baishideng Publishing Group Inc.
World J Gastroenterol. Jun 21, 2014; 20(23): 7392-7402
Published online Jun 21, 2014. doi: 10.3748/wjg.v20.i23.7392
Published online Jun 21, 2014. doi: 10.3748/wjg.v20.i23.7392
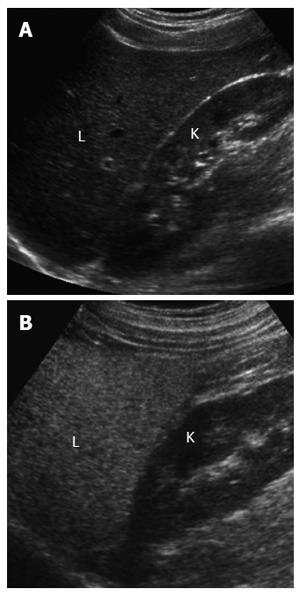
Figure 1 Ultrasonography evaluation of hepatic steatosis.
A: Ultrasonography (US) image of a normal liver, showing that the echogenicity of liver parenchyma (L) and kidney cortex (K) is similar; B: US image of a steatotic liver, showing increased echogenicity of the liver parenchyma (L) which is clearly brighter than the kidney cortex (K).
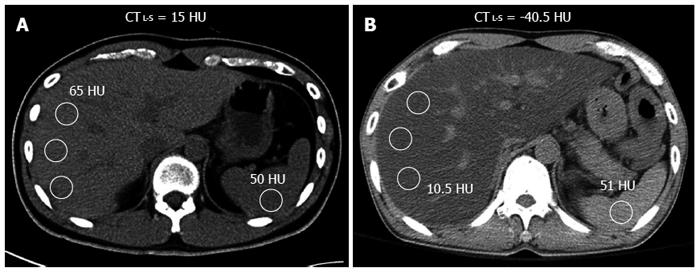
Figure 2 Computed tomography evaluation of hepatic steatosis using computed tomographyL-S index.
A: Computed tomography (CT) image of a normal liver, showing that its attenuation (65 HU) measured using regions-of-interest (white circles) was higher than that of the spleen (50 HU), and the CTL-S value was 15 HU, which lies within the normal reference range; B: CT image of a steatotic liver, showing hepatic attenuation (10.5 HU) much lower than that of the spleen (51 HU), making the CTL-S value -40.5 HU, far below the normal reference range and indicating moderate-to-severe hepatic steatosis.
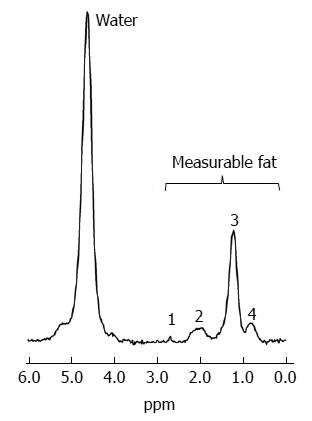
Figure 3 Magnetic resonance spectroscopy spectrum of hepatic fat.
Water and fat peaks are displayed at different frequencies; water appears as a single peak at 4.7 ppm, whereas fat appears as four peaks, including the dominant methylene (CH2) peak at 1.3 ppm (3), a methyl (CH3) peat at 0.9 ppm (4), an α-olefinic and α-carboxyl peak at 2.1 ppm (2), and a diacyl peak at 2.75 ppm (1); the areas of these four fat peaks and the water peak can be measured by spectral tracing. Proton density fat fraction can be calculated as (sum of fat peaks) ÷ (sum of fat peaks + water peak)[45,82].
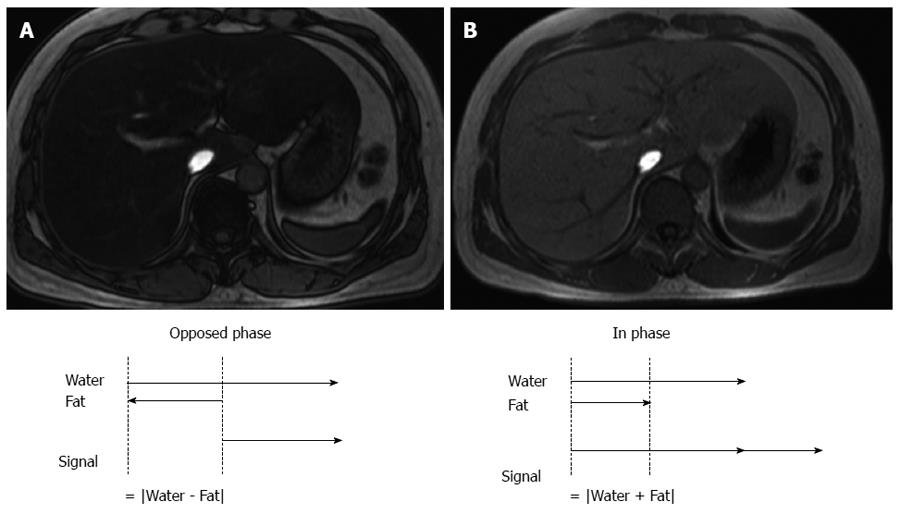
Figure 4 Dual-echo opposed-phase and in-phase chemical shift images of steatotic liver.
A: At opposed-phase (OP) (echo time = 2.3 ms at 1.5T), the protons in water and those in methylene (the largest fat moiety) are placed in opposite directions, so that the signals of these two components cancel each other. Therefore, the liver appears dark (i.e., decreased signal); B: At in-phase (IP), the protons in water and those in methylene are positioned in the same direction so that their signals are added. Liver fat fraction can be calculated based on signal intensities on OP and IP images as (signal at IP - signal at OP) ÷ 2 × signal on IP; the signal fat fraction calculated with dual-echo chemical shift images was not corrected for the T2* effect, and therefore may not accurately determine proton density fat fraction.
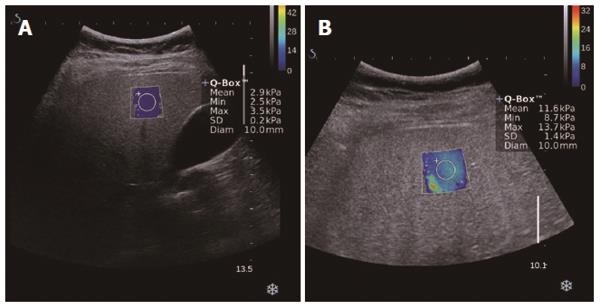
Figure 5 Supersonic shearwave elastography of simple steatosis vs nonalcoholic steatohepatitis.
A: Supersonic shearwave elastography image of the liver with simple steatosis shows a mean liver stiffness value of 2.9 kPa, which lies within the normal reference range; B: Supersonic shearwave elastography image of the liver with nonalcoholic steatohepatitis shows an elevated mean liver stiffness value of 11.6 kPa.
- Citation: Lee SS, Park SH. Radiologic evaluation of nonalcoholic fatty liver disease. World J Gastroenterol 2014; 20(23): 7392-7402
- URL: https://www.wjgnet.com/1007-9327/full/v20/i23/7392.htm
- DOI: https://dx.doi.org/10.3748/wjg.v20.i23.7392


