Copyright
©2014 Baishideng Publishing Group Inc.
World J Gastroenterol. Jun 21, 2014; 20(23): 7392-7402
Published online Jun 21, 2014. doi: 10.3748/wjg.v20.i23.7392
Published online Jun 21, 2014. doi: 10.3748/wjg.v20.i23.7392
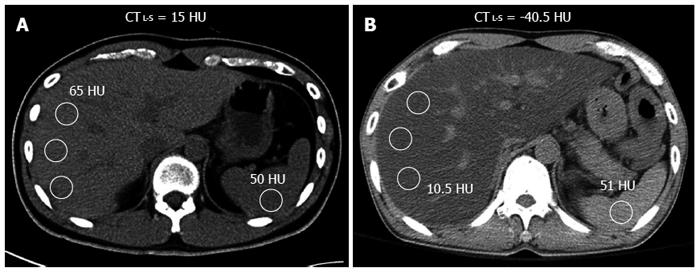
Figure 2 Computed tomography evaluation of hepatic steatosis using computed tomographyL-S index.
A: Computed tomography (CT) image of a normal liver, showing that its attenuation (65 HU) measured using regions-of-interest (white circles) was higher than that of the spleen (50 HU), and the CTL-S value was 15 HU, which lies within the normal reference range; B: CT image of a steatotic liver, showing hepatic attenuation (10.5 HU) much lower than that of the spleen (51 HU), making the CTL-S value -40.5 HU, far below the normal reference range and indicating moderate-to-severe hepatic steatosis.
- Citation: Lee SS, Park SH. Radiologic evaluation of nonalcoholic fatty liver disease. World J Gastroenterol 2014; 20(23): 7392-7402
- URL: https://www.wjgnet.com/1007-9327/full/v20/i23/7392.htm
- DOI: https://dx.doi.org/10.3748/wjg.v20.i23.7392


