Copyright
©2014 Baishideng Publishing Group Inc.
World J Gastroenterol. Jun 21, 2014; 20(23): 7392-7402
Published online Jun 21, 2014. doi: 10.3748/wjg.v20.i23.7392
Published online Jun 21, 2014. doi: 10.3748/wjg.v20.i23.7392
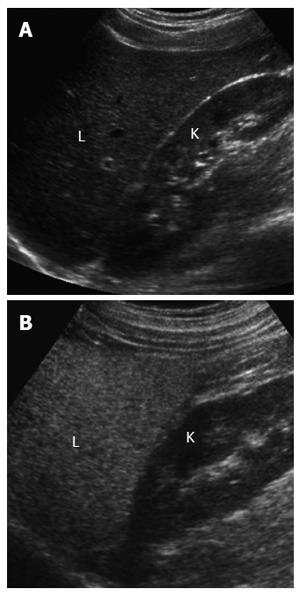
Figure 1 Ultrasonography evaluation of hepatic steatosis.
A: Ultrasonography (US) image of a normal liver, showing that the echogenicity of liver parenchyma (L) and kidney cortex (K) is similar; B: US image of a steatotic liver, showing increased echogenicity of the liver parenchyma (L) which is clearly brighter than the kidney cortex (K).
- Citation: Lee SS, Park SH. Radiologic evaluation of nonalcoholic fatty liver disease. World J Gastroenterol 2014; 20(23): 7392-7402
- URL: https://www.wjgnet.com/1007-9327/full/v20/i23/7392.htm
- DOI: https://dx.doi.org/10.3748/wjg.v20.i23.7392


