Copyright
©2014 Baishideng Publishing Group Inc.
World J Gastroenterol. Jun 14, 2014; 20(22): 7049-7054
Published online Jun 14, 2014. doi: 10.3748/wjg.v20.i22.7049
Published online Jun 14, 2014. doi: 10.3748/wjg.v20.i22.7049
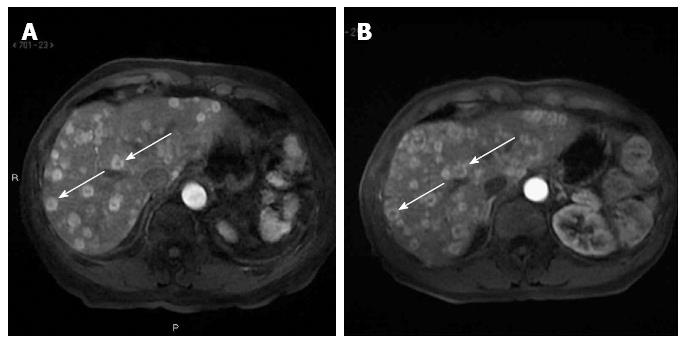
Figure 1 Abdominal magnetic resonance at diagnosis and after ten months of treatment.
A: Multiple hepatic lesions with heterogeneous characteristics: central hypodensity and peripheral hyperdensity (arrows); B: Stable disease, with a greater contrast between central and peripheral parts of the lesion as colliquative necrosis (arrows).
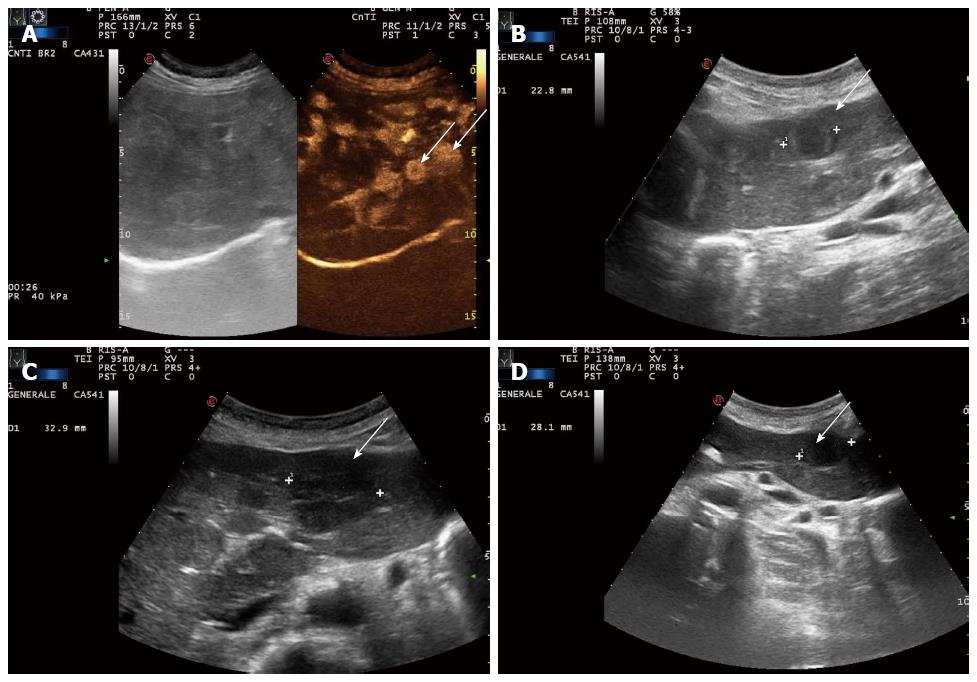
Figure 2 Ultrasound and contrast-enhanced ultrasound of the liver at diagnosis, six months after the beginning of treatment, five months after lenalidomide interruption, and six months after lenalidomide reintroduction.
A: Multiple lesions visualized in the arterial phase (arrows); B: Stable disease (arrow); C: Target lesion is increased (32.9 mm now vs 22.8 mm previously) (arrow); D: Target lesion is slightly decreased in size again (28.1 mm) (arrow).
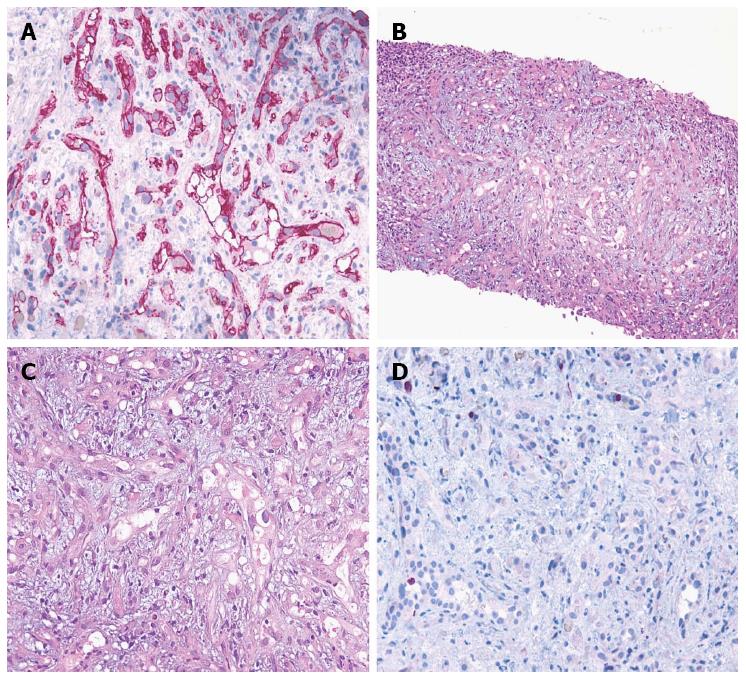
Figure 3 Pathological and immunohistochemical evaluation.
A: Hematoxylin-eosin section at 100 microscopic fields; B Hematoxylin-eosin section at 200 microscopic fields; C: Immunohistochemical expression of vascular cell marker CD34 at 200 microscopic fields (APAAP technique; Gill’s hematoxylin nuclear counterstain); D: Neoplastic cells showing a low proliferation index/MIB1 at 200 microscopic fields (APAAP technique; Gill’s hematoxylin nuclear counterstain). APAAP: Alkaline phosphatase monoclonal anti-alkaline phosphatase.
- Citation: Pallotti MC, Nannini M, Agostinelli C, Leoni S, Scioscio VD, Mandrioli A, Lolli C, Saponara M, Pileri S, Bolondi L, Biasco G, Pantaleo MA. Long-term durable response to lenalidomide in a patient with hepatic epithelioid hemangioendothelioma. World J Gastroenterol 2014; 20(22): 7049-7054
- URL: https://www.wjgnet.com/1007-9327/full/v20/i22/7049.htm
- DOI: https://dx.doi.org/10.3748/wjg.v20.i22.7049


