Copyright
©2014 Baishideng Publishing Group Co.
World J Gastroenterol. Jan 14, 2014; 20(2): 384-400
Published online Jan 14, 2014. doi: 10.3748/wjg.v20.i2.384
Published online Jan 14, 2014. doi: 10.3748/wjg.v20.i2.384
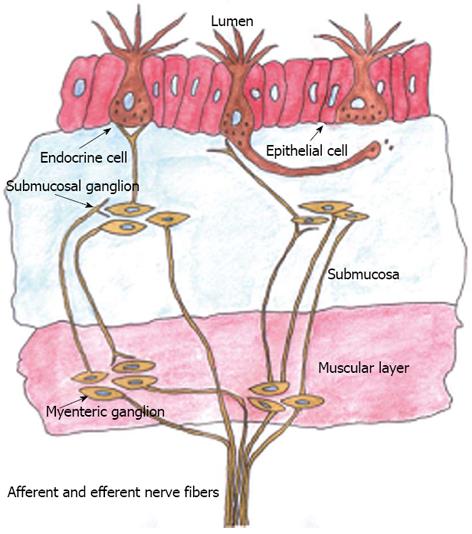
Figure 1 Schematic illustration of the gut neuroendocrine regulatory system.
The endocrine cells are scattered among the epithelial cells and have specialized microvilli that project into the lumen and function as sensors of the gut contents, and they respond to luminal stimuli by releasing hormones into the lamina propria, where they exert their action locally on nearby structures. These endocrine cells interact with the enteric nervous system, which is in turn connected to and modulated by the central nervous system through afferent and efferent nerves.
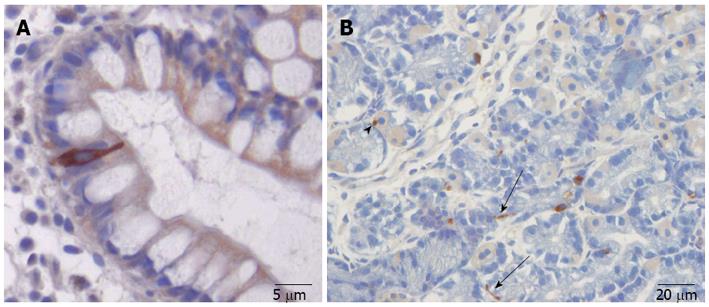
Figure 2 The gut endocrine cells.
A: A chromogranin-A-immunoreactive endocrine cell in the ileum. The endocrine cell extends from the basal membrane of the mucosa that project into the gut lumen; B: Somatostatin-immunoreactive cells in the gastric oxyntic mucosa. Note the long cytoplasmic processes (arrows), which can occasionally be seen to end at the base of parietal cells (arrowhead).
Figure 3 Ghrelin-immunoreactive cells.
A: Ghrelin-immunoreactive cells in the gastric oxyntic mucosa of a healthy subject; B: In a patient with irritable bowel syndrome (IBS) with diarrhea as the predominant bowel symptom (IBS-D); C: In a patient with IBS with constipation as the predominant bowel symptom (IBS-C). The density of ghrelin cells is higher in IBS-D and lower in IBS-C than in the healthy control.
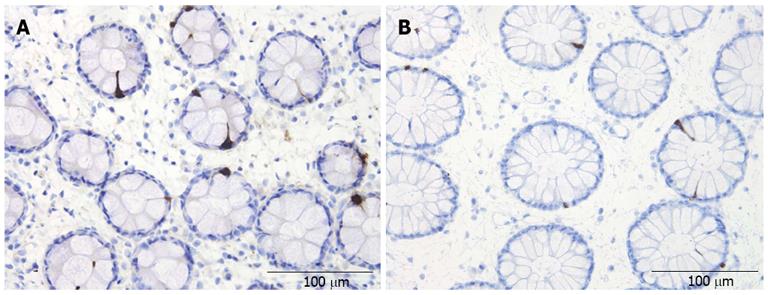
Figure 4 Peptide YY-immunoreactive cells.
A: In the colon of a healthy subject; B: In a patient with irritable bowel syndrome (IBS). The density of peptide YY cells in the colon is lower in IBS patients than in healthy controls.
- Citation: El-Salhy M, Gundersen D, Gilja OH, Hatlebakk JG, Hausken T. Is irritable bowel syndrome an organic disorder? World J Gastroenterol 2014; 20(2): 384-400
- URL: https://www.wjgnet.com/1007-9327/full/v20/i2/384.htm
- DOI: https://dx.doi.org/10.3748/wjg.v20.i2.384


