Copyright
©2014 Baishideng Publishing Group Co.
World J Gastroenterol. May 14, 2014; 20(18): 5191-5204
Published online May 14, 2014. doi: 10.3748/wjg.v20.i18.5191
Published online May 14, 2014. doi: 10.3748/wjg.v20.i18.5191
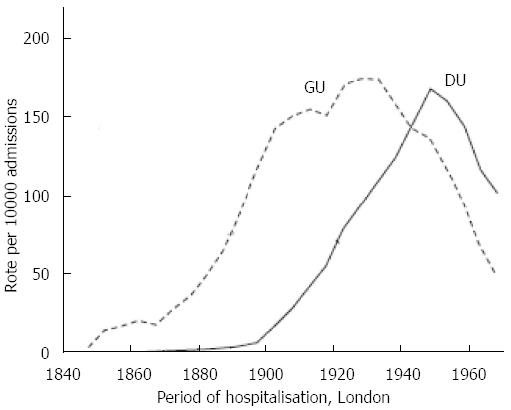
Figure 1 Admissions for gastric ulcer and duodenal ulcer in 12 London hospitals associated with a medical school presented as mean rates per 10000 admissions in each of five year periods plotted as the moving average of three consecutive time periods.
Adapted from[1] with permission. GU: Gastric ulcer; DU: Duodenal ulcer.
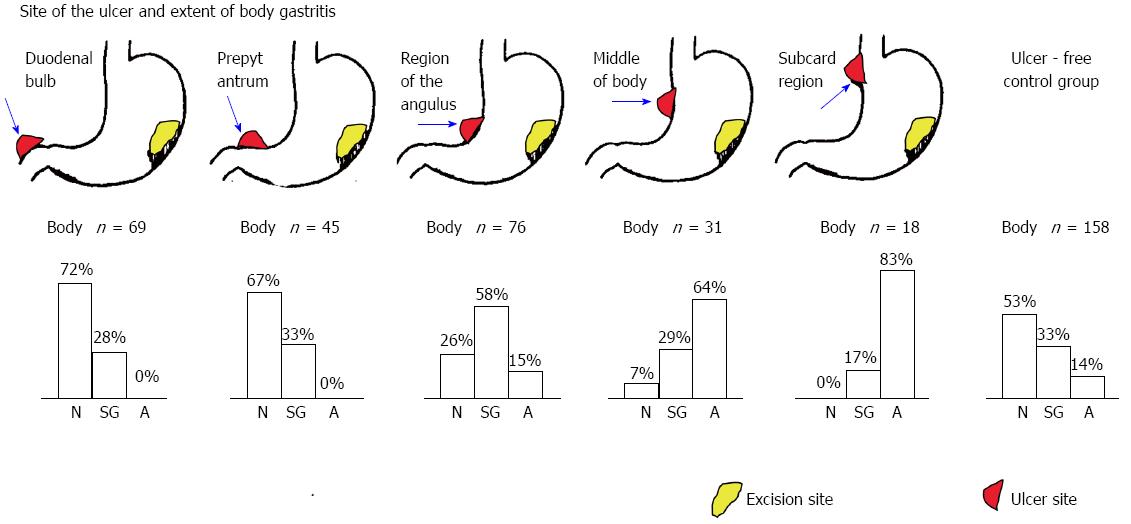
Figure 2 Examples of the relation of the site of a peptic ulcer and its relation to the extent and severity of corpus gastritis/gastric atrophy.
The number of cases sampled for each ulcer site are shown. The control group consisted of 158 individuals without a peptic ulcer. Adapted from[13] with permission. N: Normal; SG: Superficial gastritis; A: Atrophy.
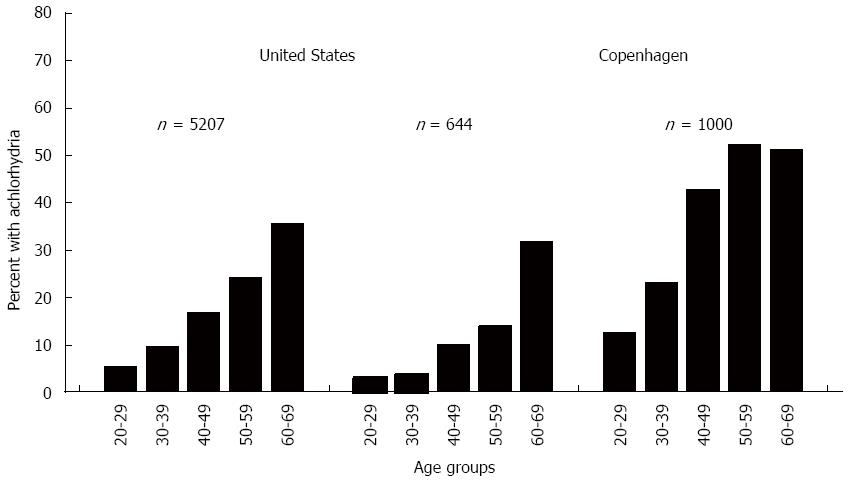
Figure 3 Prevalence of atrophic gastritis/atrophy in the early twentieth century.
Example of studies in the United States and Europe showing the high prevalence of atrophic gastritis/atrophy as evidenced by the age-related prevalence of achlorhydria (from[17], with permission).
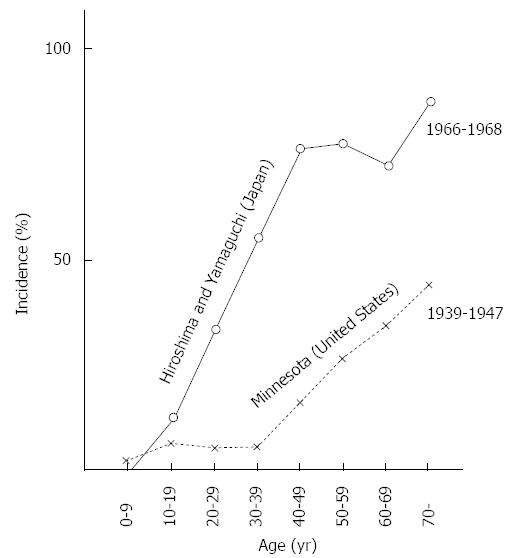
Figure 4 Comparison of the prevalence of intestinal metaplasia on gastric antral biopsies in two areas of Japan and in one area in Minnesota, United States.
Adapted from[47] with permission.
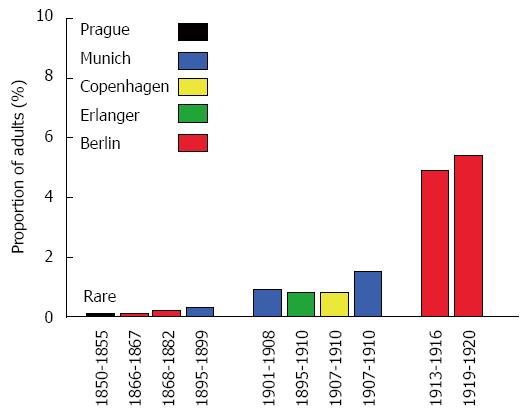
Figure 5 Autopsy data from Europe showing the proportion of adults (i.
e., 10 or older) from large autopsy studies in which the presence of an ulcer or ulcer scar was specifically examined showing the increase in the incidence of duodenal ulcer in the latter part of the 19th and early 20th century. Data from refererence[48].
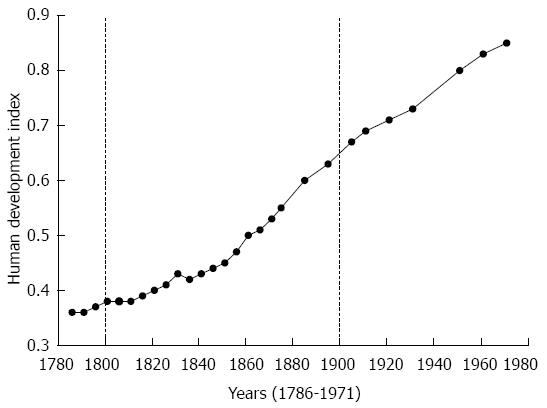
Figure 6 Health, height, and welfare: Britain between 1700 and 1980 based on the human development index which is a composite statistic of life expectancy, education, and income indices used to rank human development.
A score below 0.5 signifies low development and 0.8 or greater, high development. Data from[59].
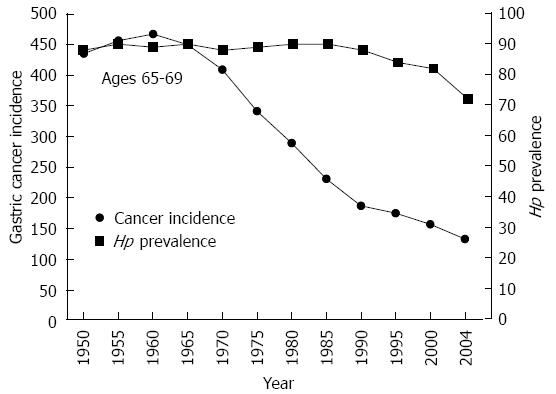
Figure 7 Changes in the incidence of gastric cancer and Helicobacter pylori infection among Japanese men age 65-69 during the latter half of the 20th century (Constance Wang and David Y Graham, unpublished observations).
From reference[86], with permission. Hp: Helicobacter pylori.
Figure 8 In this 65 years old cohort the change in gastric incidence occurred without a change in the prevalence of Helicobacter pylori.
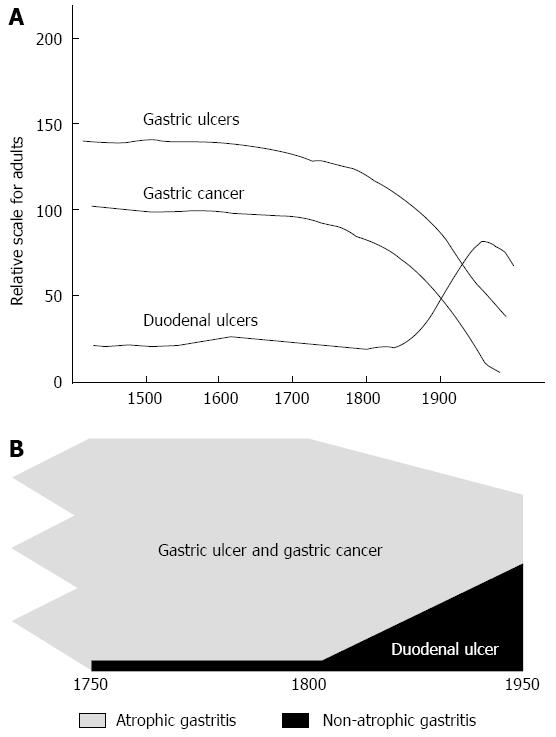
A: Model showing that gastric ulcer and gastric cancer were present and relatively common until the early 20th century when changes in the pattern of gastritis and also the prevalence of Helicobacter pylori (H. pylori) infection separately led to a reduction in incidence. In contrast, the change in the pattern of gastritis and new diagnostic modalities led to ascendance of duodenal ulcer until the rise was overtaken by the fall in H. pylori prevalence (the scale is arbitrary); B: The same results shown in relation to the underlying pathology, atrophic pangastritis which manifests clinically as gastric ulcer or cancer and non-atrophic gastritis which manifests as duodenal ulcer.
-
Citation: Graham DY. History of
Helicobacter pylori , duodenal ulcer, gastric ulcer and gastric cancer. World J Gastroenterol 2014; 20(18): 5191-5204 - URL: https://www.wjgnet.com/1007-9327/full/v20/i18/5191.htm
- DOI: https://dx.doi.org/10.3748/wjg.v20.i18.5191


