Copyright
©2014 Baishideng Publishing Group Co.
World J Gastroenterol. Apr 28, 2014; 20(16): 4662-4674
Published online Apr 28, 2014. doi: 10.3748/wjg.v20.i16.4662
Published online Apr 28, 2014. doi: 10.3748/wjg.v20.i16.4662
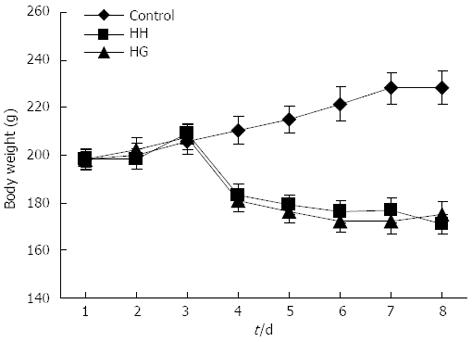
Figure 1 Effects of glutamine treatment on body weight in rats of different groups.
Gln: Glutamine; Control: Control group; HH: Hypobaric hypoxia group; HG: Hypobaric hypoxia plus Gln group.
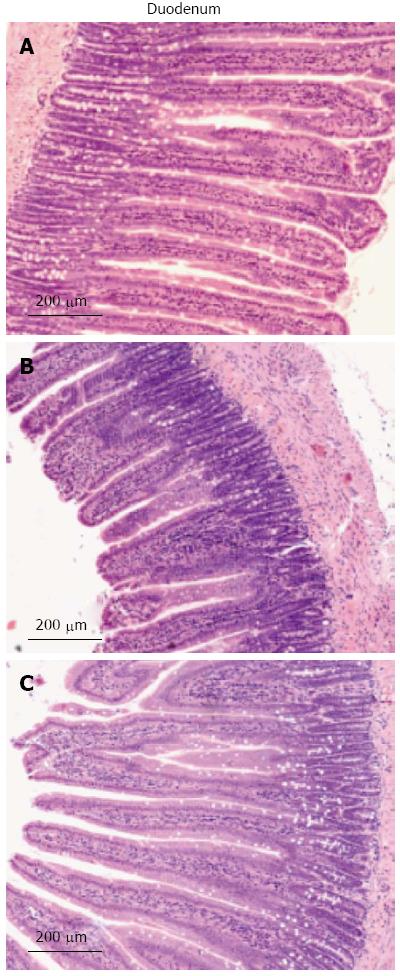
Figure 2 Effects of glutamine on intestinal morphology in rats.
Smooth intestinal mucosa with intact epithelia and ordered villi in the control group, atrophic and thinned villi with a loose and disordered arrangement, and exfoliated and incomplete intestinal mucosa in the hypobaric hypoxia (HH) group, and relatively intact intestinal villi with an ordered and tight arrangement in the hypobaric hypoxia + Gln (5.0 g/kg BW·d) (HG) group (hematoxylin and eosin, × 200). A: Control; B: HH; C: HG.
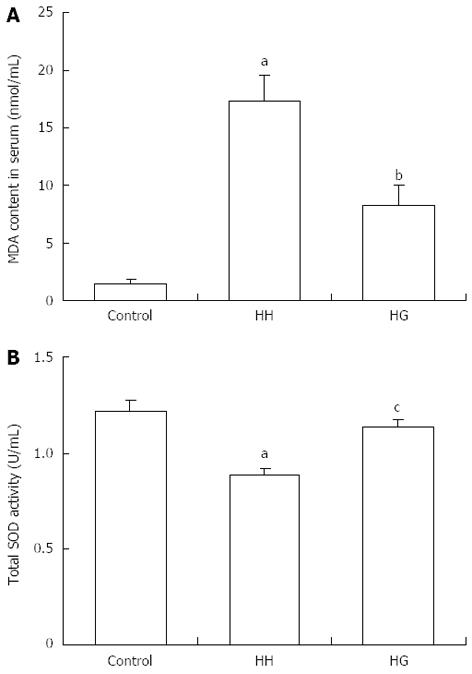
Figure 3 Effects of glutamine treatment on malondialdehyde contents in serum (A) and superoxide dismutase (B).
aP < 0.001 vs Control; bP < 0.05, cP < 0.01 vs HH. Values are expressed as mean ± SEM (n = 7, each). Gln: Glutamine; SOD: superoxide dismutase, MDA: malondialdehyde; Control: Control group; HH: Hypobaric hypoxia group; HG: Hypobaric hypoxia plus Gln treatment group.
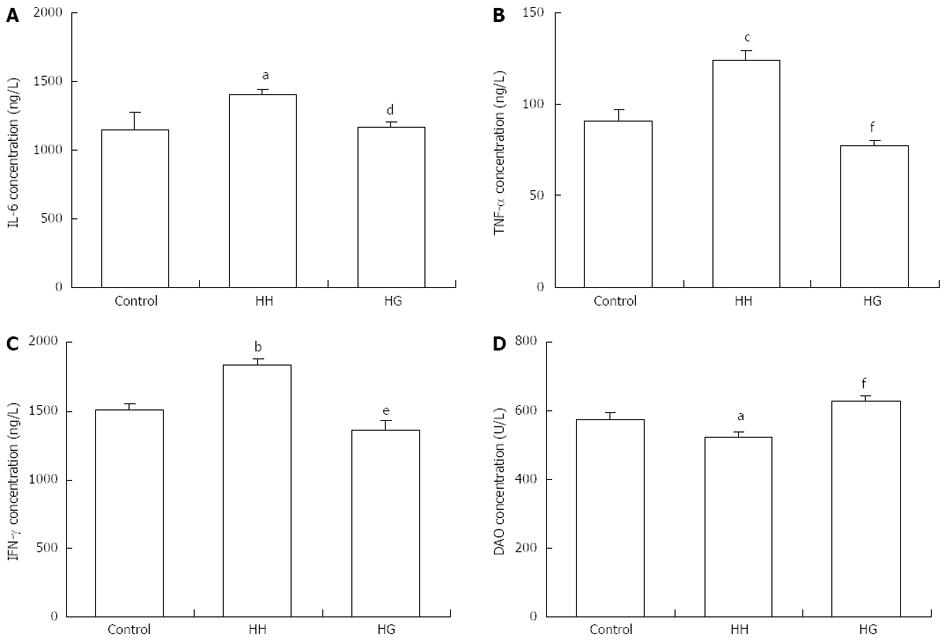
Figure 4 Effects of glutamine treatment on interleukin-6 (A), tumor necrosis factor-α (B), interferon-γ (C) and diamine oxidase contents in serum (D).
aP < 0.05, bP < 0.01, cP < 0.001 vs Control; dP < 0.05, eP < 0.01, fP < 0.001 vs HH. Values are expressed as mean ± SEM (n = 7, each). Gln: Glutamine; IL-6: Interleukin-6; TNF-α: Tumor necrosis factor-alpha; IFN-γ: Interferon-gamma; DAO: Diamine oxidase; Control: Control group; HH: Hypobaric hypoxia group; HG: Hypobaric hypoxia plus Gln treatment group.
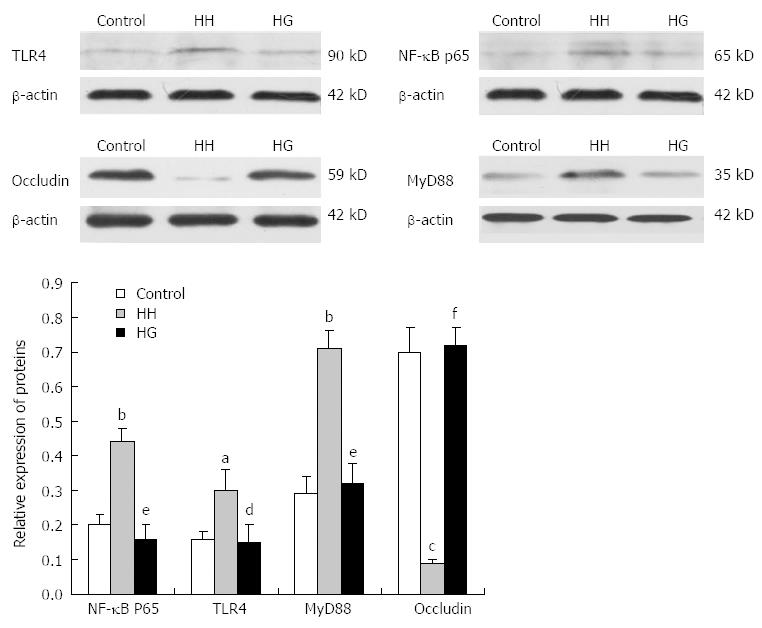
Figure 5 Toll-like receptor 4, nuclear factor-κB, myeloid differentiation factor 88, and occludin protein expression in the ileum of rats of different groups determined by Western blotting.
The occludin expression level in the HH group was lower than that in the Control group. After Gln treatment, the occludin expression level in the HG group was significantly higher than that in the HH group. aP < 0.05, bP < 0.01, cP < 0.001 vs Control; dP < 0.05, eP < 0.01, fP < 0.001 vs HH. Values presented as means ± SEM (n = 4, each). Gln: Glutamine; Control: Control group; HH: Hypobaric hypoxia group; HG: Hypobaric hypoxia plus Gln group.
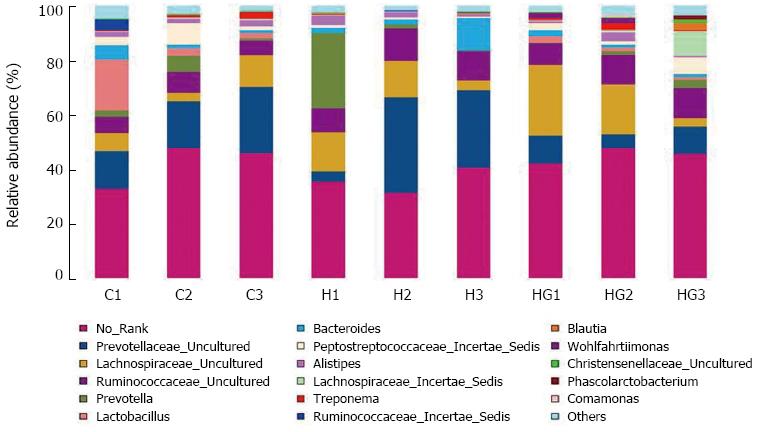
Figure 6 Bacterial composition differences.
Relative read abundance of different bacterial genera within the different communities. Sequences that could not be classified into any known group were assigned as “No_Rank”.
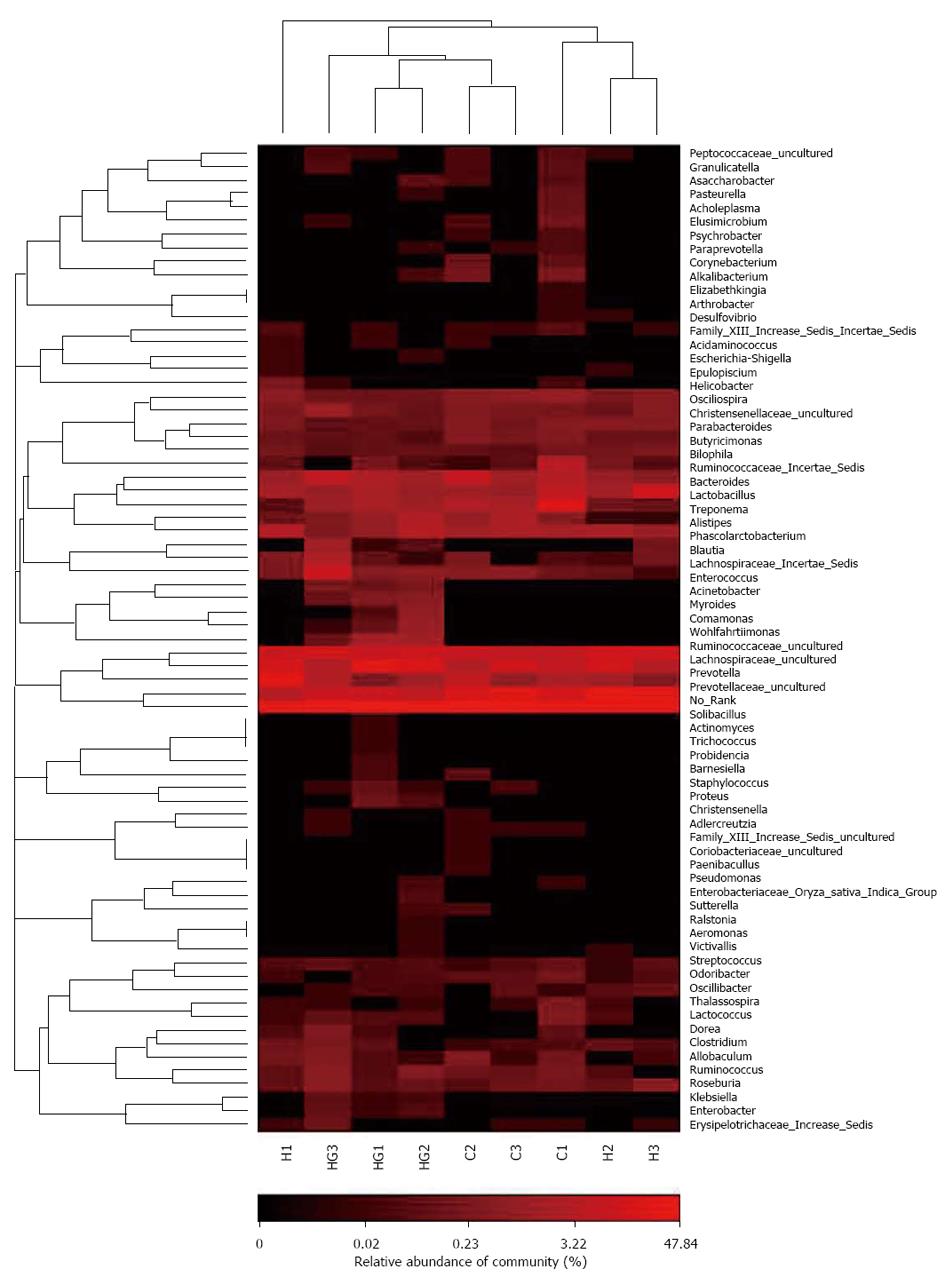
Figure 7 Bacterial distribution among the nine groups.
Double hierarchical dendrogram showing the bacterial distribution among the nine groups. The bacterial phylogenetic tree was calculated using the neighbor-joining method and the relationship among samples was determined by Bray distance and the complete clustering method. The heatmap plot depicts the relative percentage of each bacterial family shown in the legend indicated at the bottom of the figure. Clusters based on the distance of the seven samples along the X-axis and the bacterial families along the Y-axis are indicated in the upper and left portions of the figure, respectively.
- Citation: Xu CL, Sun R, Qiao XJ, Xu CC, Shang XY, Niu WN. Protective effect of glutamine on intestinal injury and bacterial community in rats exposed to hypobaric hypoxia environment. World J Gastroenterol 2014; 20(16): 4662-4674
- URL: https://www.wjgnet.com/1007-9327/full/v20/i16/4662.htm
- DOI: https://dx.doi.org/10.3748/wjg.v20.i16.4662


