Copyright
©2014 Baishideng Publishing Group Co.
World J Gastroenterol. Apr 28, 2014; 20(16): 4648-4661
Published online Apr 28, 2014. doi: 10.3748/wjg.v20.i16.4648
Published online Apr 28, 2014. doi: 10.3748/wjg.v20.i16.4648
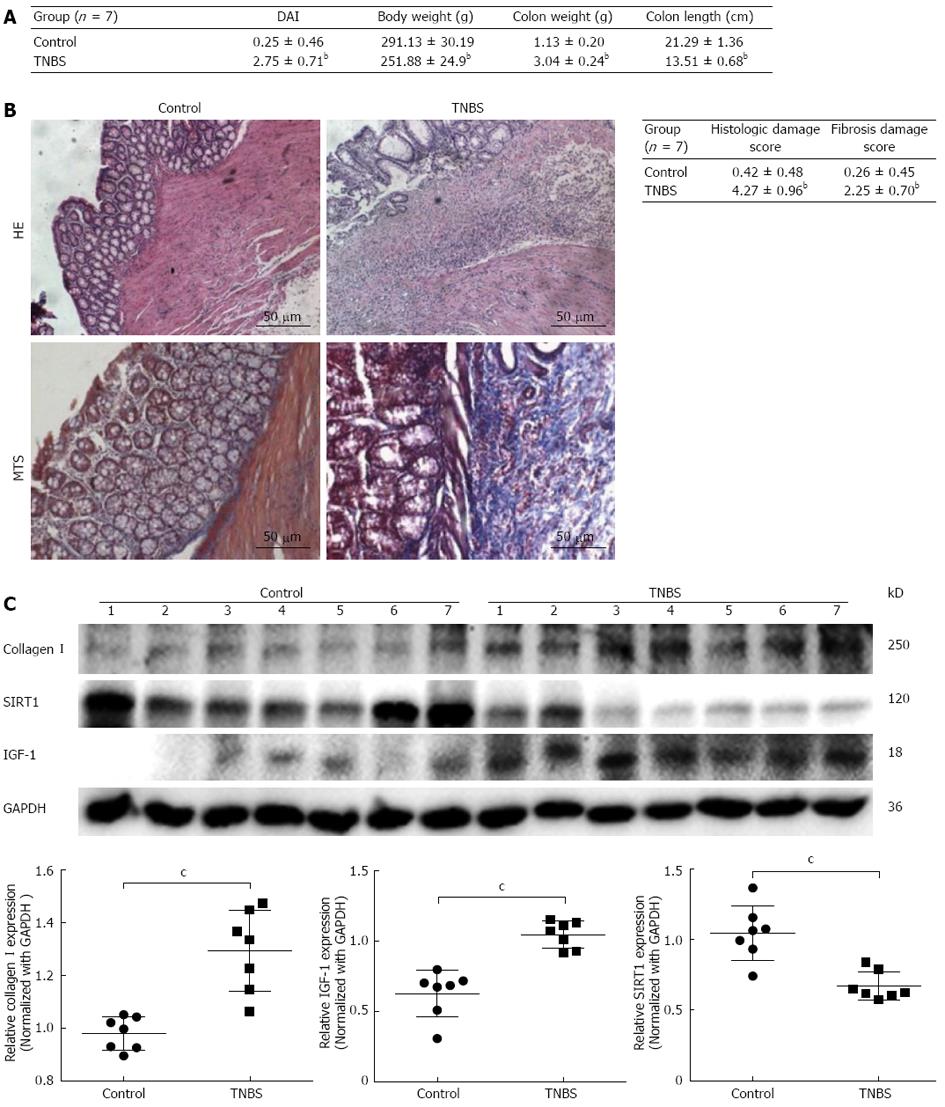
Figure 1 Silent information regulator 1 expression is decreased in 2,4,6-trinitrobenzenesulfonic acid-induced colitis.
A, B: Change of clinical symptoms shown by disease activity index (DAI) and histological characterization of 2,4,6-trinitrobenzenesulfonic acid (TNBS)-induced colitis (original magnification × 200); C: The proteins collagen I, insulin growth factor-1 (IGF-1) and silent information regulator 1 (SIRT1) levels were measured by Western blotting. Data are expressed as mean ± SD (n = 7 in each group). bP < 0.01 vs those of normal rats. MTS: Masson’s trichrome staining; GAPDH: Glyceraldehyde 3-phosphate dehydrogenase.
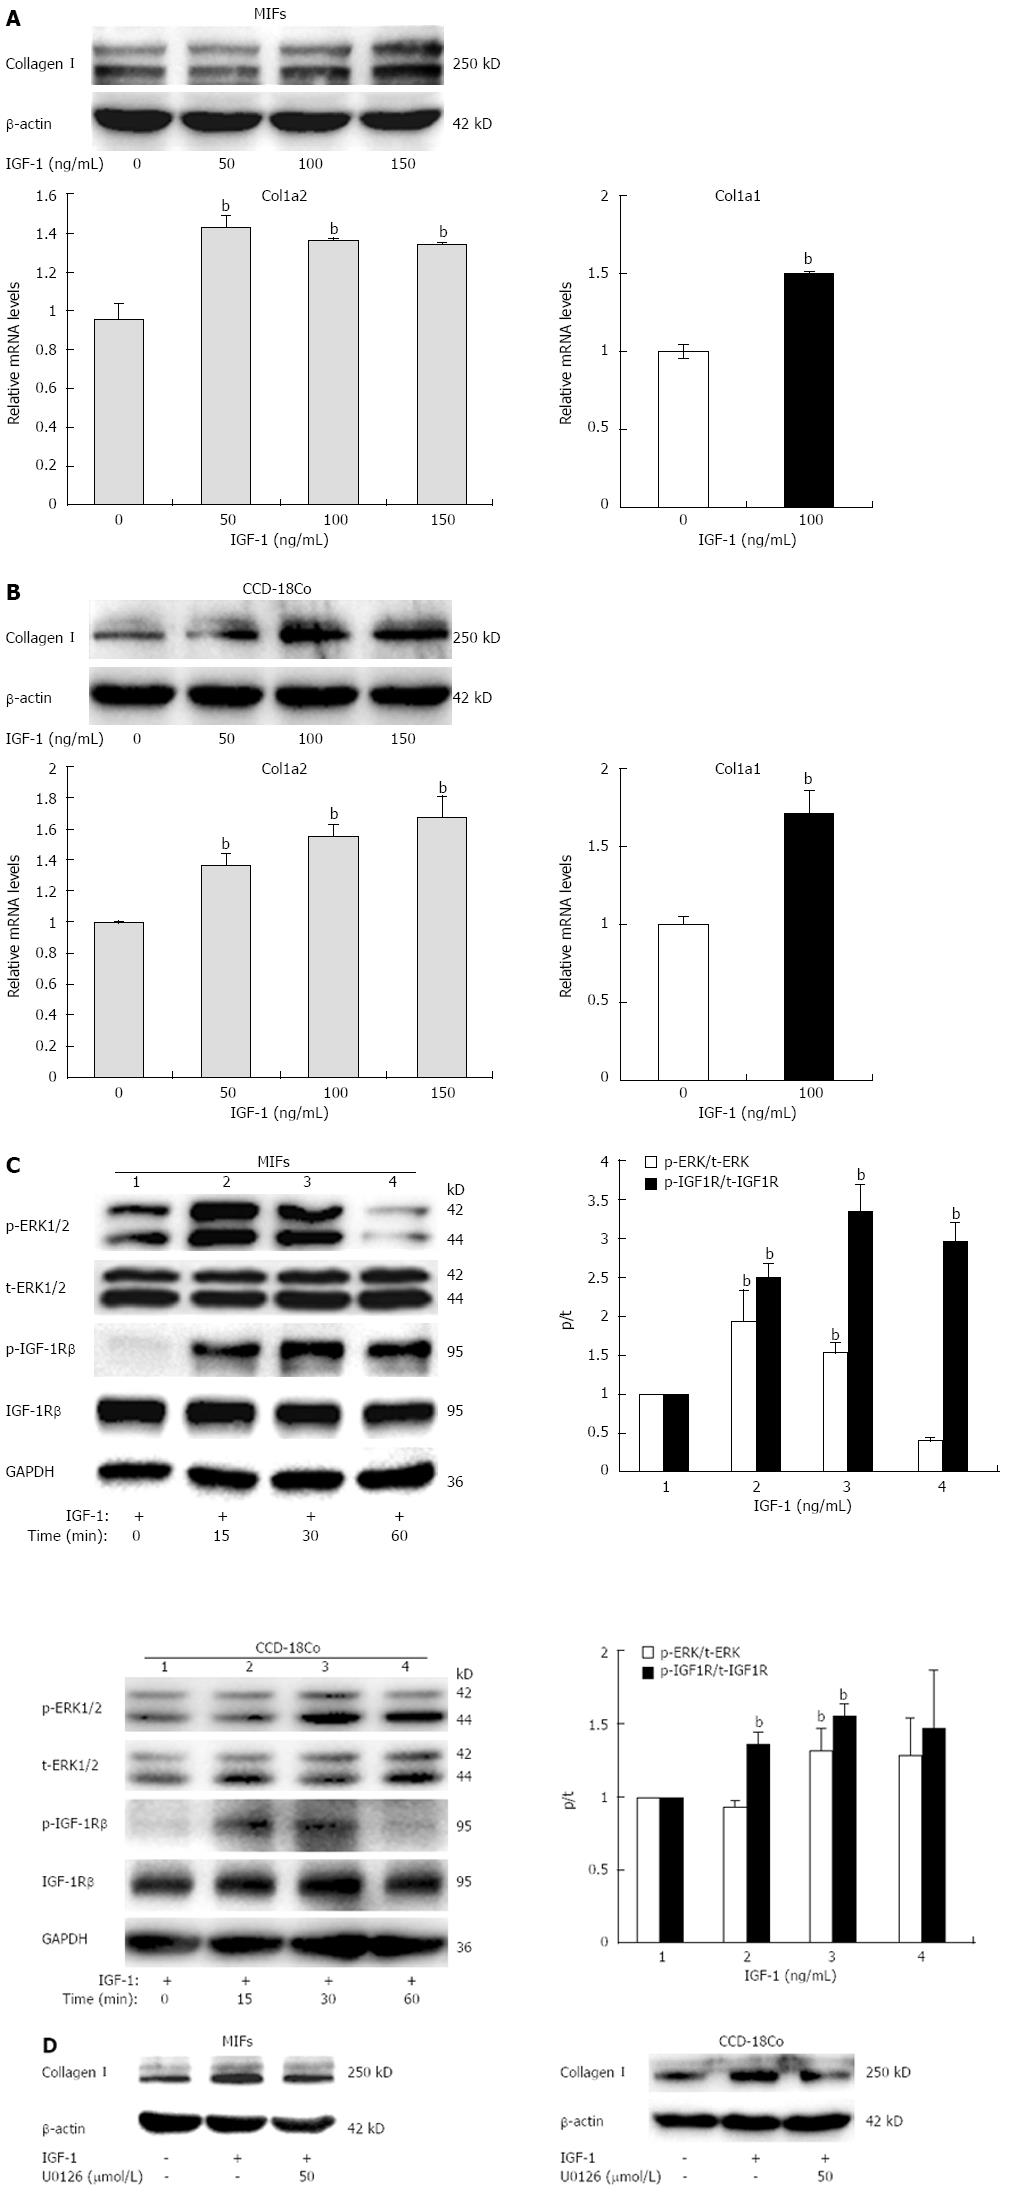
Figure 2 Insulin growth factor-1 induces collagen I expression via mitogen-activated protein-kinase pathway.
A, B: Collagen I protein and col1a2, col1a1 mRNA expression in mouse intestinal fibroblasts (MIFs) and CCD-18Co cells stimulated with increasing concentrations of insulin growth factor-1 (IGF-1) for 24 h; C: Phosphorylation of IGF-1 receptor (IGF-1R) (p-IGF-1R) and extracellular signal-regulated kinase 1/2 (ERK1/2) (p-ERK1/2) in MIFs and CCD-18Co exposed to 100 ng/mL IGF-1 for 0, 15, 30, or 60 min. The bar graph represents the quantitation of the Western blotting normalized to the control; D: Cells were pretreated with 50 μmol/L mitogen-activated protein/extracellular signal-regulated kinase kinase (MEK)/ERK inhibitor U0126 or vehicle for 1 h and then coincubated with 100 ng/mL IGF-1 for 24 h. Collagen I protein level was measured. The experiment was repeated three times and obtained similar results. Values represent mean ± SD. bP < 0.01 vs no treatment group. GAPDH: Glyceraldehyde 3-phosphate dehydrogenase.
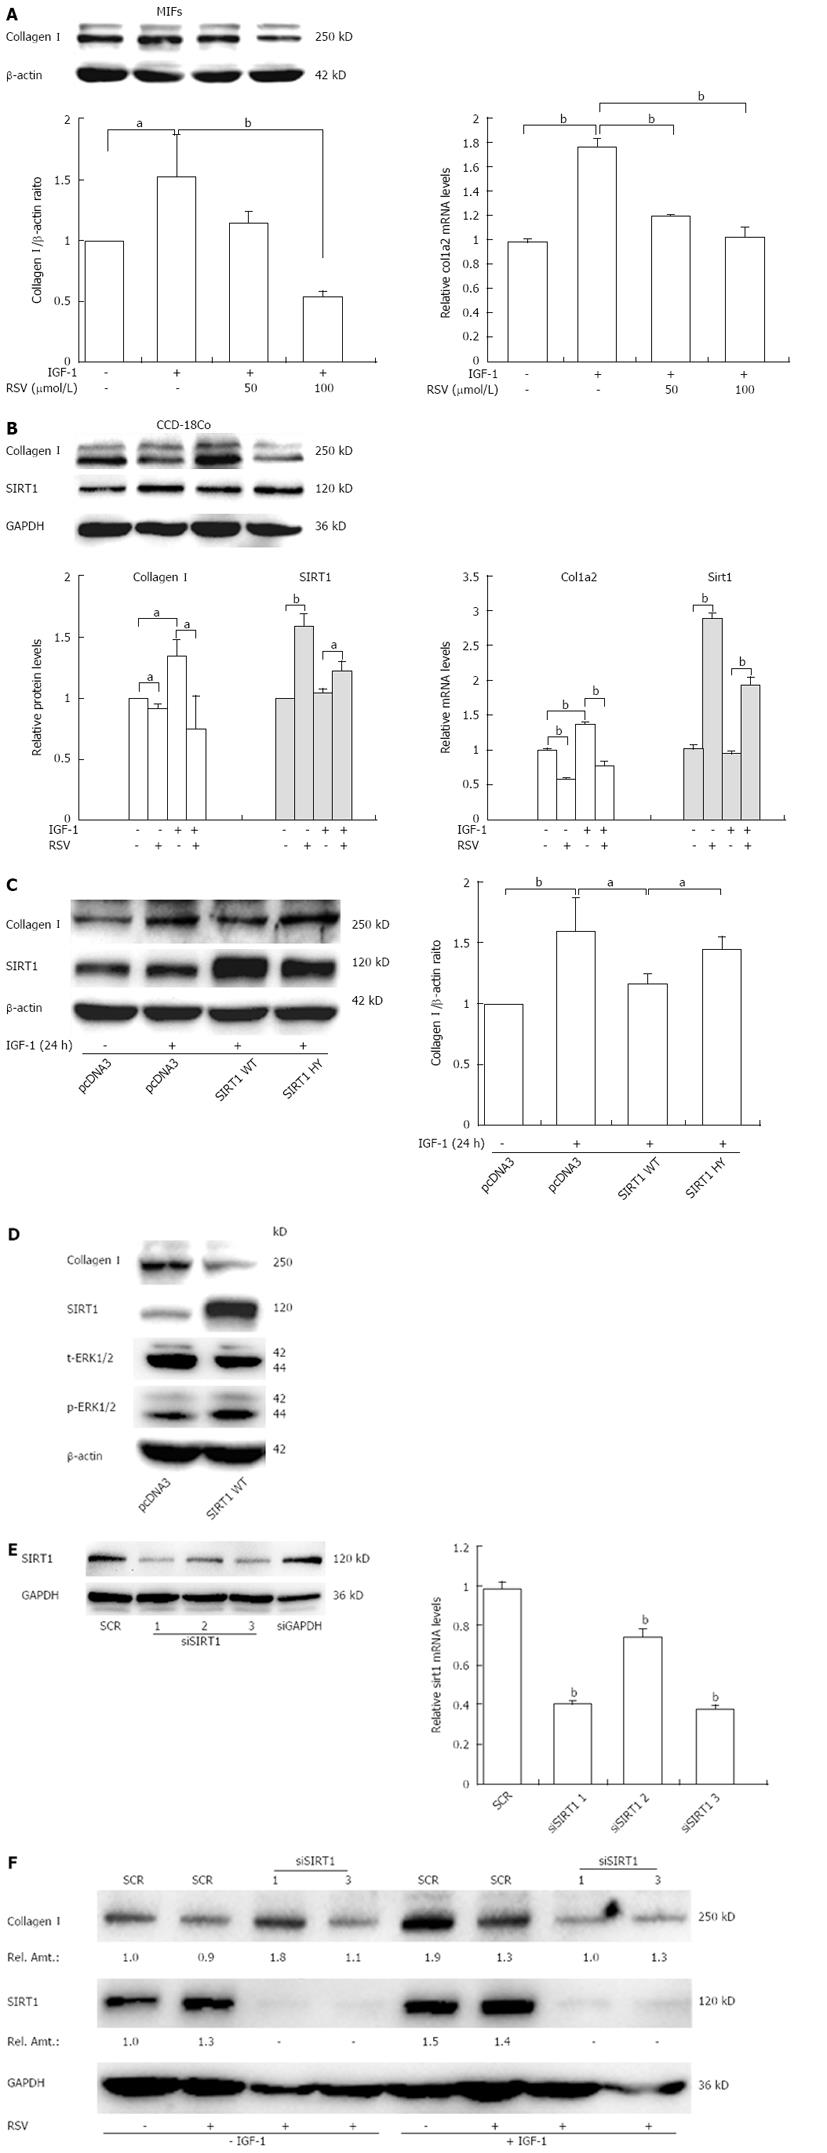
Figure 3 Resveratrol inhibits insulin growth factor-1-induced collagen I expression partly through silent information regulator 1.
A, B: Collagen I protein and col1a2 mRNA expression were measured in fibroblasts stimulated with insulin growth factor-1 (IGF-1) (100 ng/mL) or IGF-1 plus resveratrol (RSV 50, 100 μmol/L) for 24 h; C: Wild type silent information regulator 1 (SIRT1) (WT) or enzyme deficient SIRT1 (HY) constructs were transfected into CCD-18Co cells followed by treatment with IGF-1. Collagen I protein was measured by Western blotting; D: Cells were transfected with the empty vector (pcDNA3.0) or SIRT1 WT, then collagen I, SIRT1, phosphorylation of extracellular signal-regulated kinase (ERK) (p-ERK) or total ERK1/2 (t-ERK1/2) were examined by Western blotting; E: 293T cells were transiently transfected with SIRT1-specific small interfering RNAs (siRNAs) (1, 2, 3) or scrambled siRNA (SCR) for 48 h, then SIRT1 protein and mRNA expression was measured by Western blotting and quantitative real-time polymerase chain reaction; F: CCD-18Co cells were transfected with SIRT1 siRNAs (1, 3) or SCR followed by treatment with resveratrol. The collagen I/glyceraldehyde 3-phosphate dehydrogenase (GAPDH) ratio shows the quantification of the expression levels of collagen I (Relative Amount). The experiment was repeated three times and obtained similar results. Values represent mean ± SD. aP < 0.05, bP < 0.01 vs control.
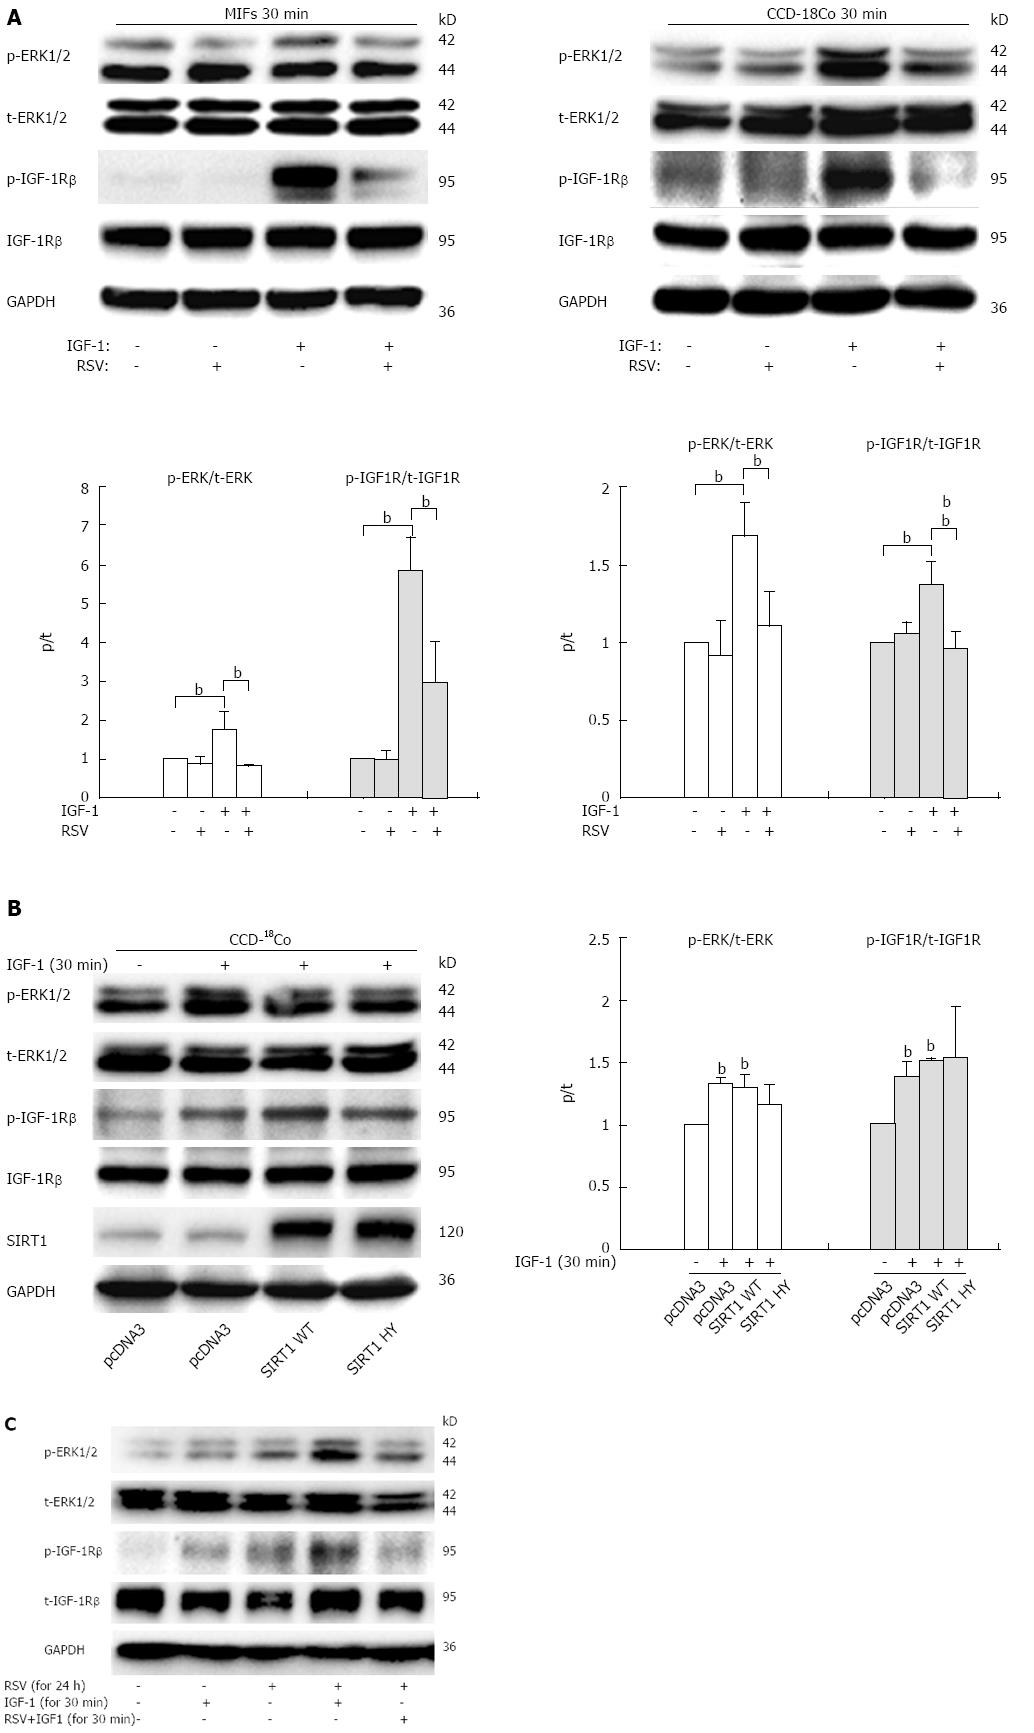
Figure 4 Resveratrol attenuates insulin growth factor-1 receptor and extracellular signal-regulated kinase 1/2 phosphorylation induced by insulin growth factor-1 via a silent information regulator 1-independent pathway.
A: Mouse intestinal fibroblasts (MIFs) and CCD-18Co cells were treated with 100 ng/mL insulin growth factor-1 (IGF-1) in the absence or presence of resveratrol (100 μmol/L) for 30 min; B: CCD-18Co cells were transfected with silent information regulator 1 (SIRT1) expression constructs [wild type SIRT1 (WT) or enzyme deficient SIRT1 (HY)] followed by exposure to 100 ng/mL IGF-1 for 30 min. The phosphorylated levels of IGF-1R and extracellular signal-regulated kinase (ERK)1/2 were measured; C: Serum-starved quiescent CCD-18Co cells were pretreated with 100 μmol/L of resveratrol for 24 h, then removed and stimulated with IGF-1 alone (column 4) or IGF-1 plus resveratrol (column 5) for 30 min. The bar graph represents the quantitation of the Western blotting normalized to the control. The experiment was repeated three times and obtained similar results. Values represent mean ± SD. bP < 0.01 vs control.
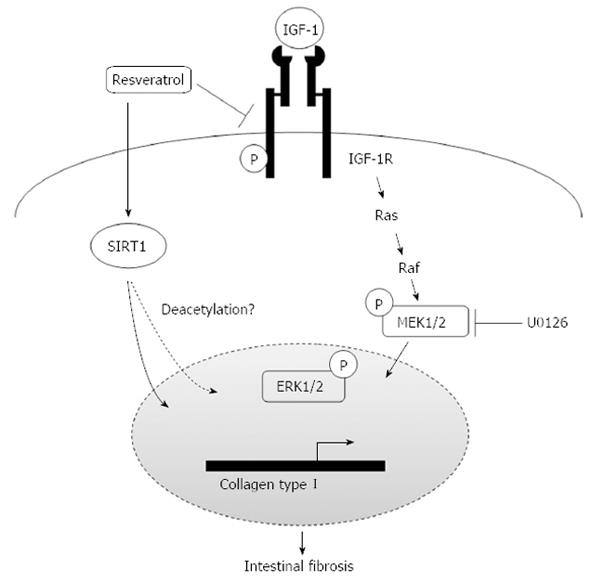
Figure 5 Proposed mechanism by which resveratrol inhibits insulin growth factor-1-induced collagen I synthesis in intestinal fibroblasts.
SIRT1: Silent information regulator 1; IGF-1: Insulin growth factor-1; ERK: Extracellular signal- regulated kinase; MEK: Mitogen-activated protein/extracellular signal-regulated kinase kinase; IGF-1R: IGF-1 receptor.
- Citation: Li P, Liang ML, Zhu Y, Gong YY, Wang Y, Heng D, Lin L. Resveratrol inhibits collagen I synthesis by suppressing IGF-1R activation in intestinal fibroblasts. World J Gastroenterol 2014; 20(16): 4648-4661
- URL: https://www.wjgnet.com/1007-9327/full/v20/i16/4648.htm
- DOI: https://dx.doi.org/10.3748/wjg.v20.i16.4648


