Copyright
©2014 Baishideng Publishing Group Co.
World J Gastroenterol. Apr 21, 2014; 20(15): 4407-4413
Published online Apr 21, 2014. doi: 10.3748/wjg.v20.i15.4407
Published online Apr 21, 2014. doi: 10.3748/wjg.v20.i15.4407
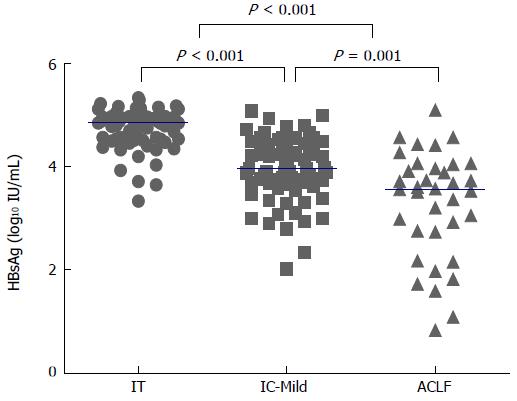
Figure 1 Distribution of serum hepatitis B surface antigen levels in the three groups of hepatitis B e antigen-positive chronic hepatitis B patients.
Median values are presented. There was a significant difference between these three groups (IT vs IC-Mild, P < 0.001; IC-Mild vs ACLF P = 0.001; IT vs ACLF, P < 0.001). CHB: Chronic hepatitis B; IT: Immune-tolerant patients; IC-Mild: Patients with a mild immune response in the immune clearance phase; ACLF: Patients with a dramatic immune response in the immune clearance phase and exhibiting acute on chronic liver failure; HBsAg: Hepatitis B surface antigen; HBV: Hepatitis B virus.
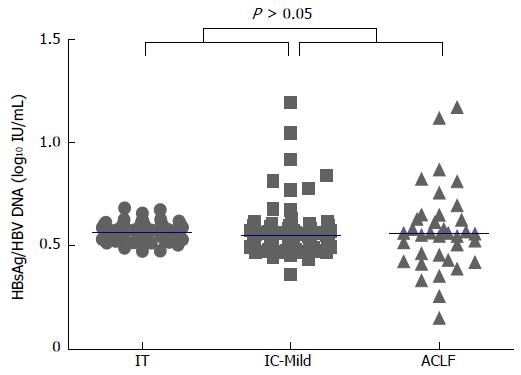
Figure 2 Ratio of hepatitis B surface antigen/hepatitis B virus DNA in the three groups of hepatitis B e antigen-positive chronic hepatitis B patients.
Median values are presented. There was no significant difference among these three groups (P > 0.05). CHB: Chronic hepatitis B; IT: Immune-tolerant patients; IC-Mild: Patients with a mild immune response in the immune clearance phase; ACLF: Patients with a dramatic immune response in the immune clearance phase and exhibiting acute on chronic liver failure; HBsAg: Hepatitis B surface antigen; HBV: Hepatitis B virus.
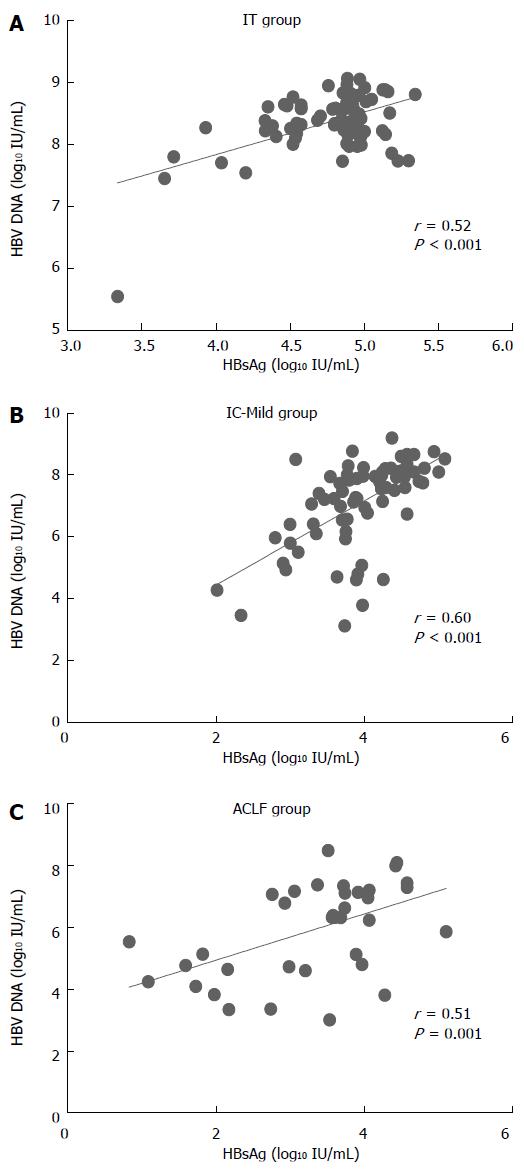
Figure 3 Correlation between serum hepatitis B surface antigen levels and hepatitis B virus DNA levels in the three groups of Hepatitis B e antigen-positive chronic hepatitis B patients.
A: Immune-tolerant patients (IT) group; B: Patients with a mild immune response in the immune clearance phase (IC-Mild) group; C: Patients with a dramatic immune response in the immune clearance phase and exhibiting acute on chronic liver failure (ACLF) group. HBsAg: Hepatitis B surface antigen; HBV: Hepatitis B virus.
- Citation: Zhang YM, Yang YD, Jia HY, Zeng LY, Yu W, Zhou N, Li LJ. HBsAg levels in HBeAg-positive chronic hepatitis B patients with different immune conditions. World J Gastroenterol 2014; 20(15): 4407-4413
- URL: https://www.wjgnet.com/1007-9327/full/v20/i15/4407.htm
- DOI: https://dx.doi.org/10.3748/wjg.v20.i15.4407


