Copyright
©The Author(s) 1996.
World J Gastroenterol. Sep 15, 1996; 2(3): 161-164
Published online Sep 15, 1996. doi: 10.3748/wjg.v2.i3.161
Published online Sep 15, 1996. doi: 10.3748/wjg.v2.i3.161
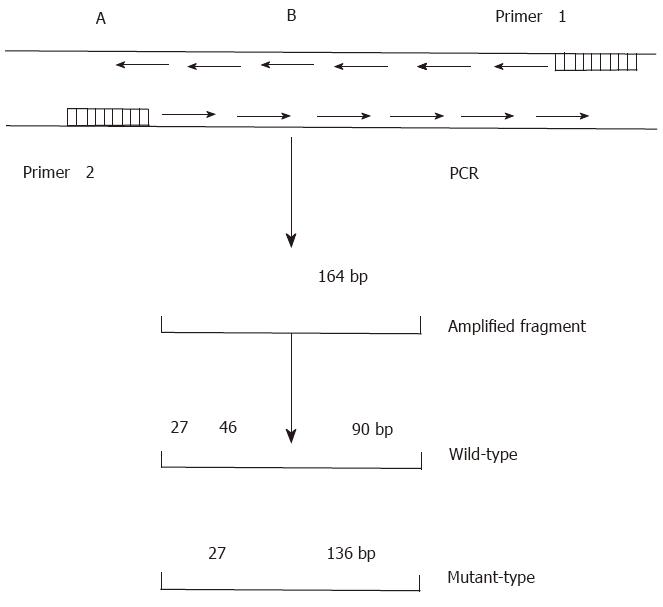
Figure 1 Schematic diagram of the p53 codon 249.
A: control cleavage site of the restriction endonuclease, Hae III. B: Hae III cleavage site in codon 249.
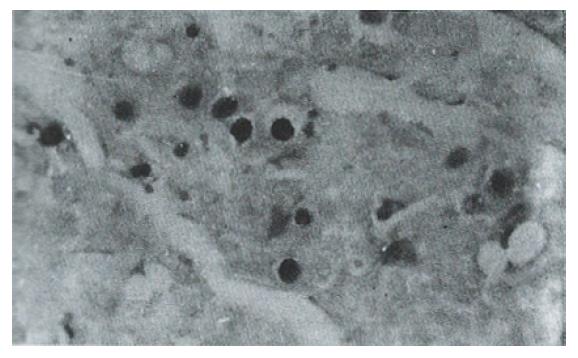
Figure 2 A well differentiated HCC with nuclear staining in carcinomatous cells in a single pattern.
Some cells also show cytoplasmic staining. Immunohistochemistry with Pab1801. ABC, × 400
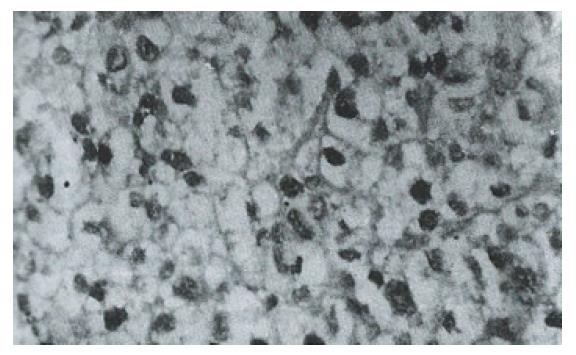
Figure 3 Moderately differentiated HCC with nuclear staining in carcinomatous cells in a diffuse pattern.
Immunohistochemistry with CM-1; ABC, × 400.
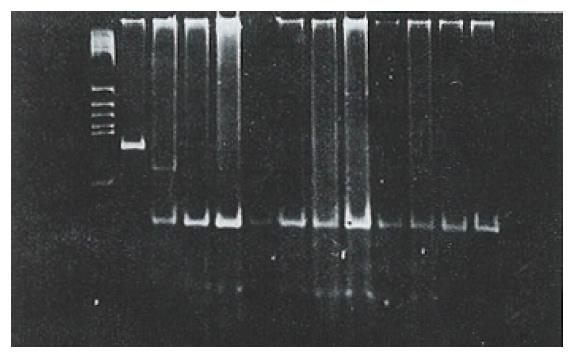
Figure 4 PCR analysis of p53 codon 249 in hepatocellular carcinoma.
M: DNA size marker (PBR322 digest of Hae III); P: Product of PCR (164 bp); N: Surrounding noncancerous tissue; T: HCC tumor tissue; T1: Mutation of codon 249; L: Normal lymphocyte.
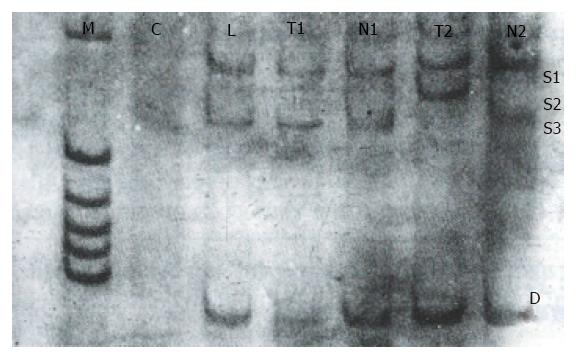
Figure 5 Analysis of p53 exon 7 by PCR-SSCP-silver staining in hepatocellular carcinoma.
C: Negative control; L: Normal lymphocyte; N: Surrounding noncancerous tissue; T: HCC tumor tissue; T2: Mobility shift; S1 S3: Single strand DNA; D: Double strand DNA
- Citation: Wang D, Shi JQ. Overexpression and mutations of tumor suppressor gene p53 in hepatocellular carcinoma. World J Gastroenterol 1996; 2(3): 161-164
- URL: https://www.wjgnet.com/1007-9327/full/v2/i3/161.htm
- DOI: https://dx.doi.org/10.3748/wjg.v2.i3.161


