Copyright
©2013 Baishideng Publishing Group Co.
World J Gastroenterol. Dec 14, 2013; 19(46): 8619-8629
Published online Dec 14, 2013. doi: 10.3748/wjg.v19.i46.8619
Published online Dec 14, 2013. doi: 10.3748/wjg.v19.i46.8619
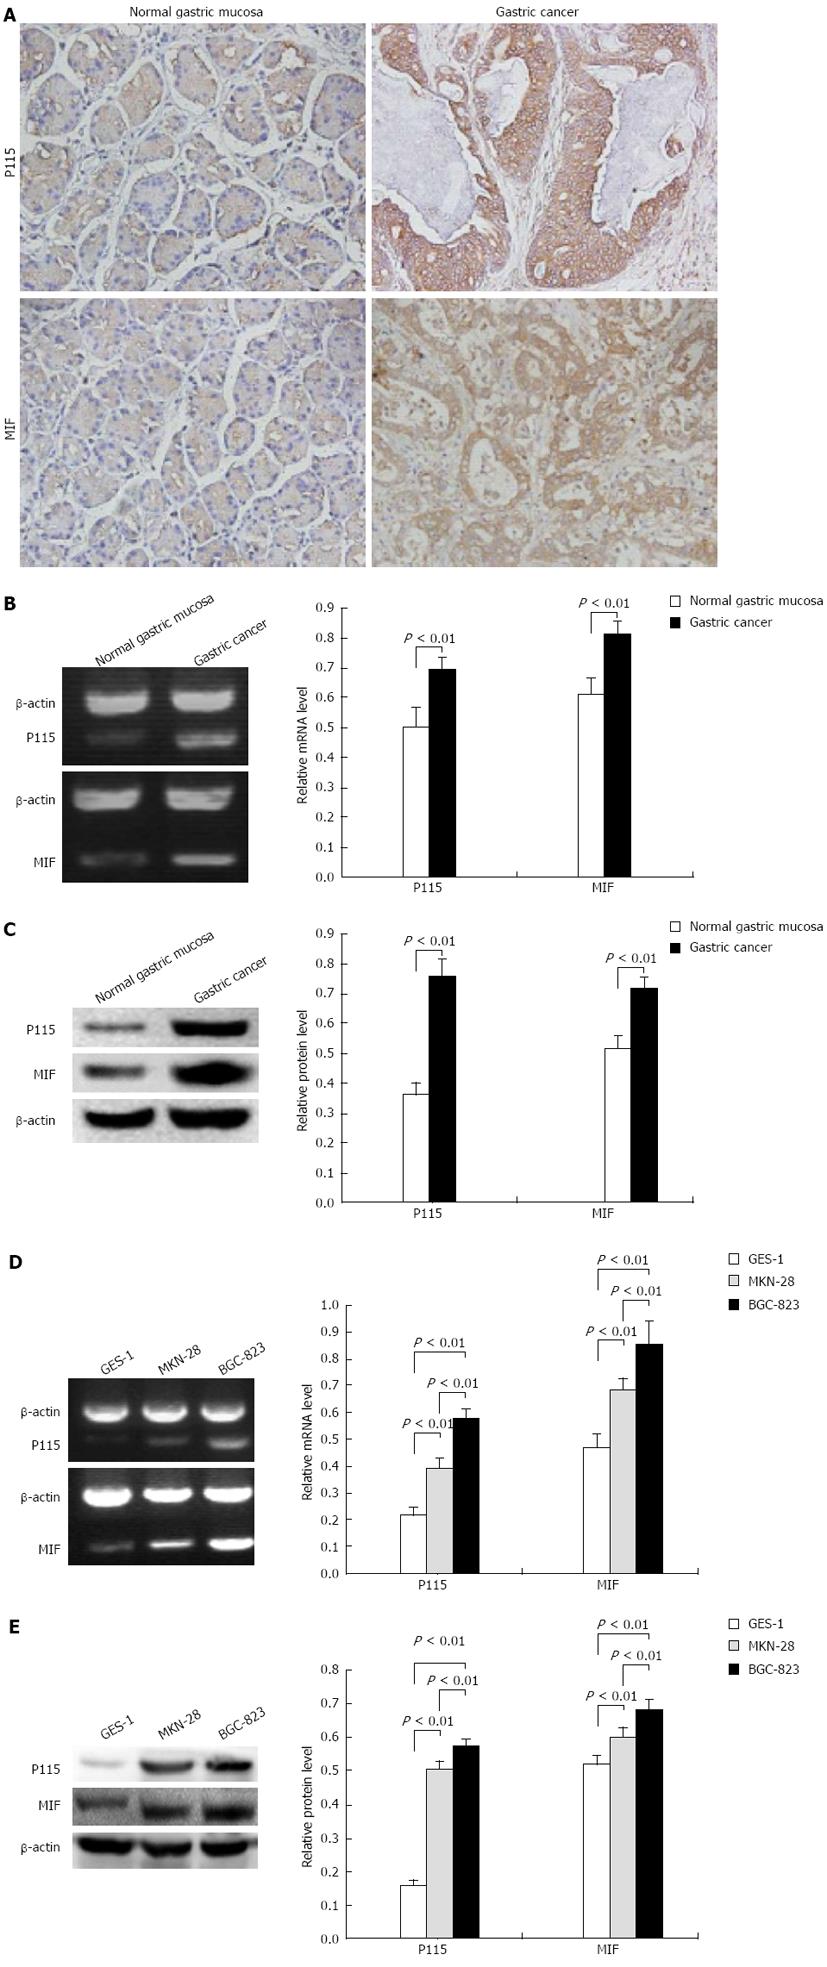
Figure 1 P115 and macrophage migration inhibitory factor were specifically expressed in gastric cancer.
A: Immunohistochemistry showed that in gastric cancer tissue, P115 was expressed in Golgi and cytoplasm near the nucleus, and macrophage migration inhibitory factor (MIF) was expressed in cytoplasm and sparsely in membrane. In normal gastric mucosa tissue, P115 and MIF were negatively expressed (DAB stained, × 200). Real-time reverse transcription-polymerase chain reaction (RT-PCR) (B) and Western blotting (C) showed that mRNA and protein levels of P115 and MIF in gastric cancer tissue were higher than those in normal gastric mucosa tissue. RT-PCR (D) and Western blotting (E) showed that mRNA and protein levels of P115 and MIF in MKN-28 and BGC-823 cells were higher than those in the normal gastric mucosa epithelial cell line GES-1. β-actin was used as a loading control for RT-PCR and Western blotting. Data are mean ± SD of three experiments.
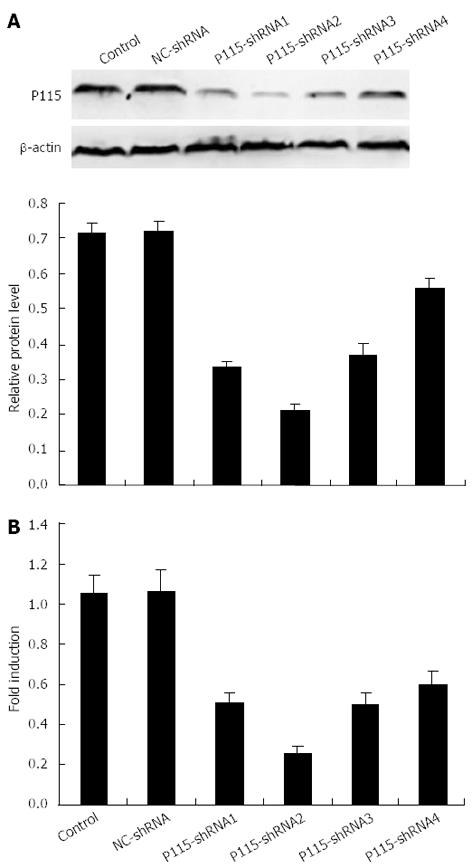
Figure 2 P115-shRNA plasmids reduced expression of P115 in BGC-823 cells.
Cells were transfected with 2 μg P115-shRNA for 36 h and P115-shRNA2 was found to have the best silencing efficacy measured by Western blotting (A) and real-time polymerase chain reaction (PCR) (B). β-actin was used as a loading control for Western blotting and glyceraldehyde 3-phosphate dehydrogenase was used as an internal control for real-time PCR. Data are mean ± SD of three experiments.
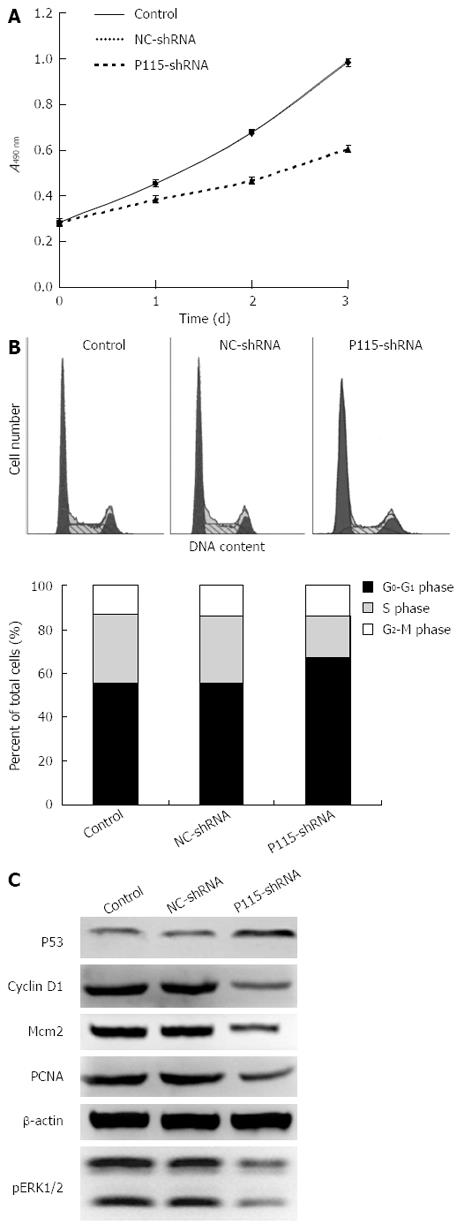
Figure 3 P115-shRNA inhibited cell proliferation and G0-G1 to S phase transition.
A: After transfection with 2 μg P115-shRNA for 24, 48 and 72 h, the proliferation rate of BGC-823 cells was inhibited as detected by MTT assay; B: BGC-823 cells were transfected with 2 μg P115-shRNA for 48 h. The cell cycle was then measured by flow cytometry (B) and cell cycle regulators were measured by Western blotting (C). β-actin was used as a control for sample loading.
Figure 4 P115-shRNA inhibited the secretion and expression of macrophage migration inhibitory in culture supernatant and cells.
A: Macrophage migration inhibitory factor (MIF) in BGC cells was extracted through protein precipitation with a multiple clone antibody, and P115 was detected in the protein complex by Western blotting; B: 48 h after transfection with 2 μg P115-shRNA, the secretion of MIF into the supernatant was inhibited as measured by ELISA. MIF in cells was reduced as measured by real-time PCR (C) and Western blotting (D). β-actin was used as a loading control for Western blotting and glyceraldehyde 3-phosphate dehydrogenase was used as an internal control for PCR. Data are mean ± SD of three experiments.
Figure 5 P115 promoted cell proliferation and G0-G1 to S phase transition.
(A) After transfection with 2 μg pEGFP-N1-P115 for 24, 48 and 72 h, the proliferation rate of MKN-28 cells was increased as detected by MTT assay. (B) MKN-28 cells were transfected with 2 μg pEGFP-N1-P115 for 48 h. The cell cycle was then measured by flow cytometry (B) and cell cycle regulators were measured by Western blotting (C). β-actin was used as a control for sample loading. Data are mean ± SD of three experiments.
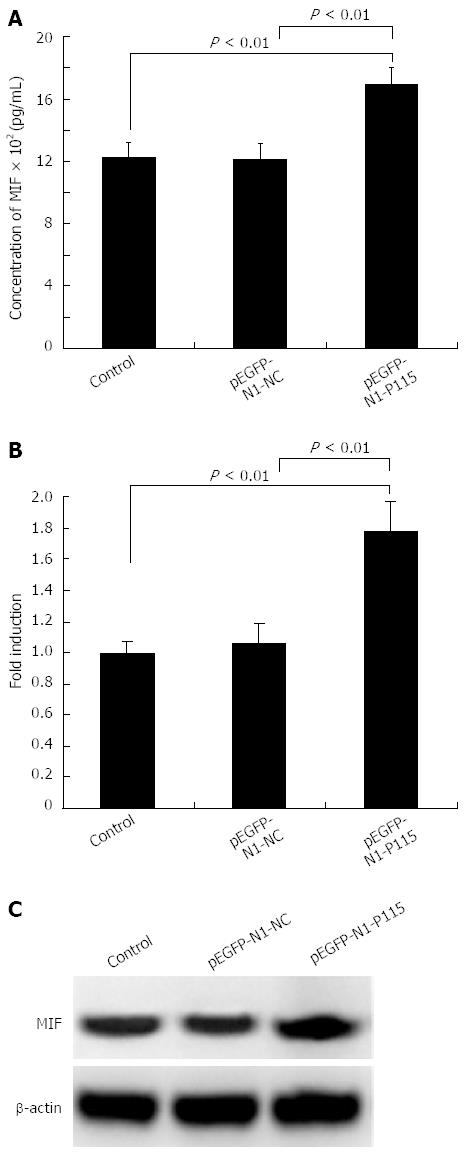
Figure 6 P115 promoted the secretion and expression of MIF in culture supernatant and cells.
(A) 48 h after transfection with 2 μg pEGFP-N1-P115, the secretion of migration inhibitory factor (MIF) into the supernatant was measured by ELISA. MIF in cells was increased by pEGFP-N1-P115 as measured by real-time polymerase chain reaction (PCR) (B) and Western blotting (C). β-actin was used as a loading control for Western blotting and glyceraldehyde 3-phosphate dehydrogenase was used as an internal control for PCR. Data are mean ± SD of three experiments.
- Citation: Li XJ, Luo Y, Yi YF. P115 promotes growth of gastric cancer through interaction with macrophage migration inhibitory factor. World J Gastroenterol 2013; 19(46): 8619-8629
- URL: https://www.wjgnet.com/1007-9327/full/v19/i46/8619.htm
- DOI: https://dx.doi.org/10.3748/wjg.v19.i46.8619


