Copyright
©2013 Baishideng Publishing Group Co.
World J Gastroenterol. Nov 21, 2013; 19(43): 7778-7787
Published online Nov 21, 2013. doi: 10.3748/wjg.v19.i43.7778
Published online Nov 21, 2013. doi: 10.3748/wjg.v19.i43.7778
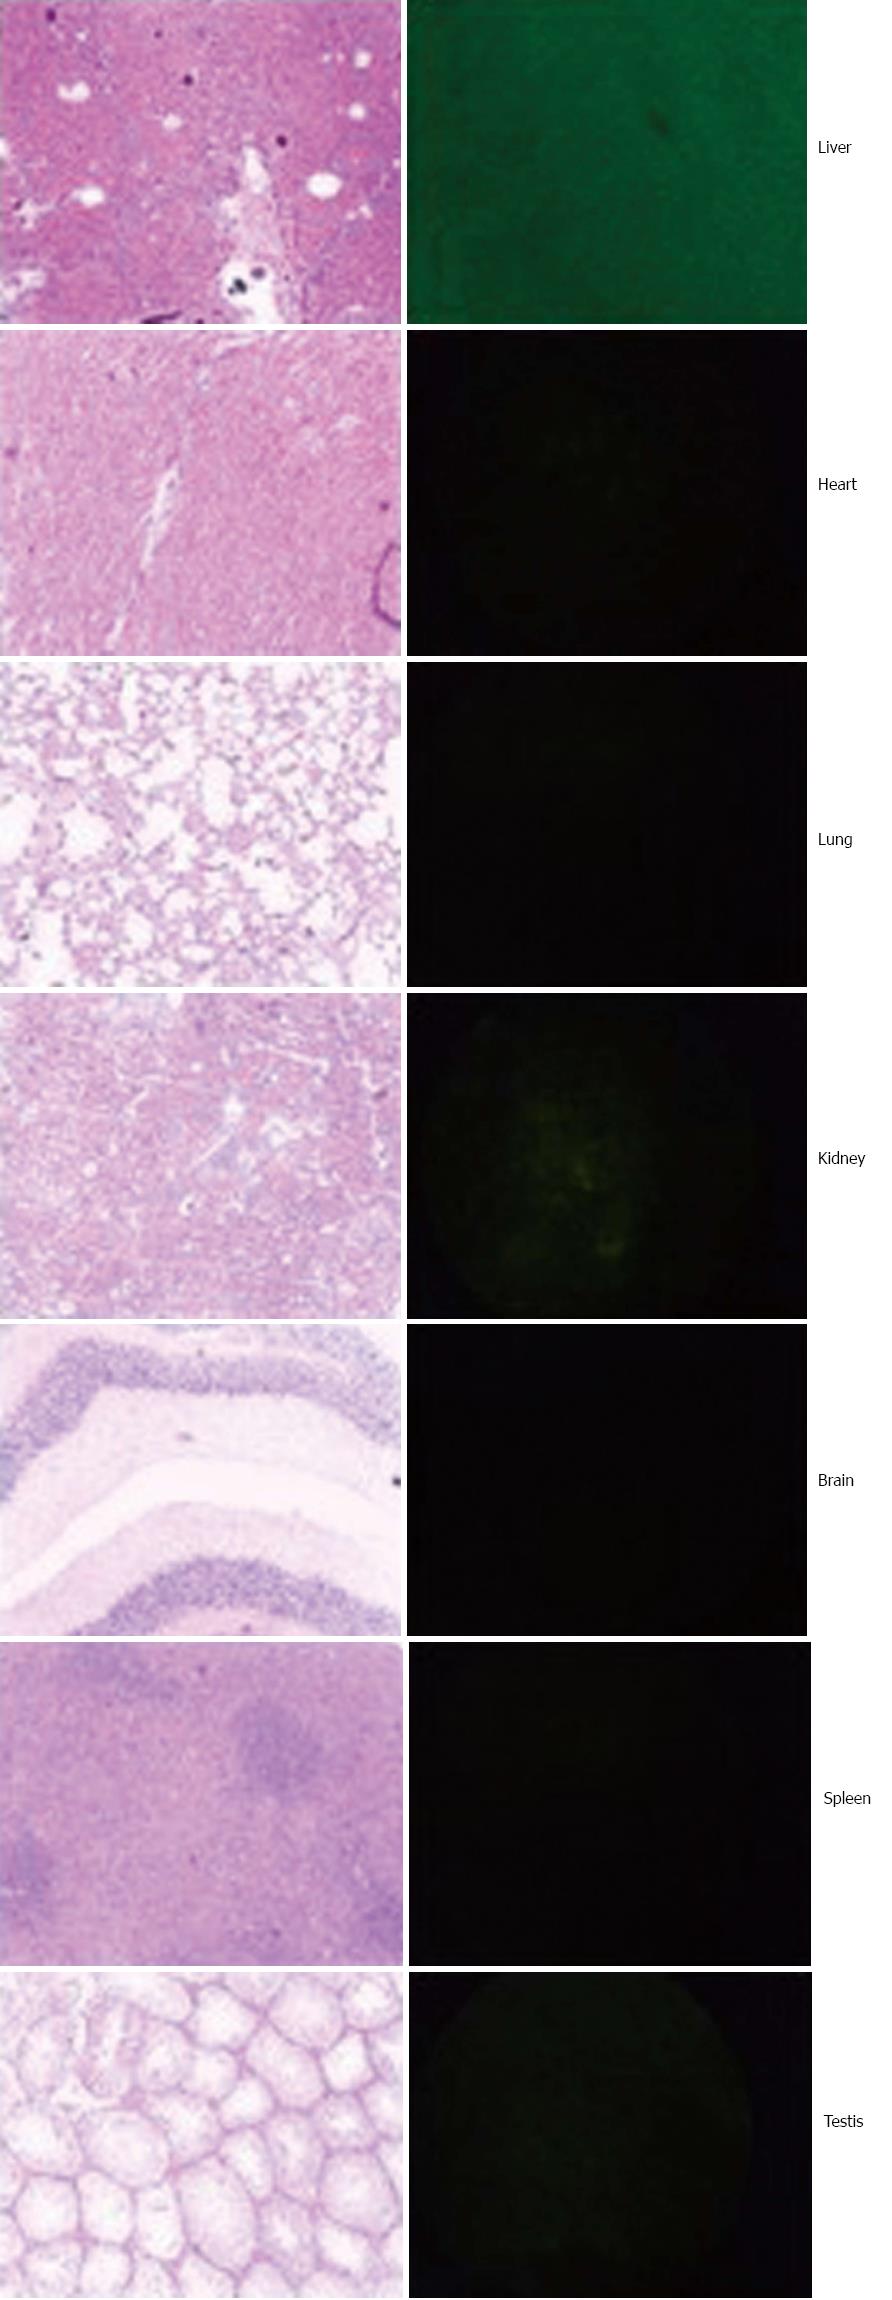
Figure 1 Tissue distribution of transferred viruses in the host.
Representative micrographs from each organ (as designated) are shown for the presence of green fluorescent protein (GFP), which is a marker for the presence of the recombinant virus. GFP was primarily observed in the liver (top panel) and rarely present in other organs.
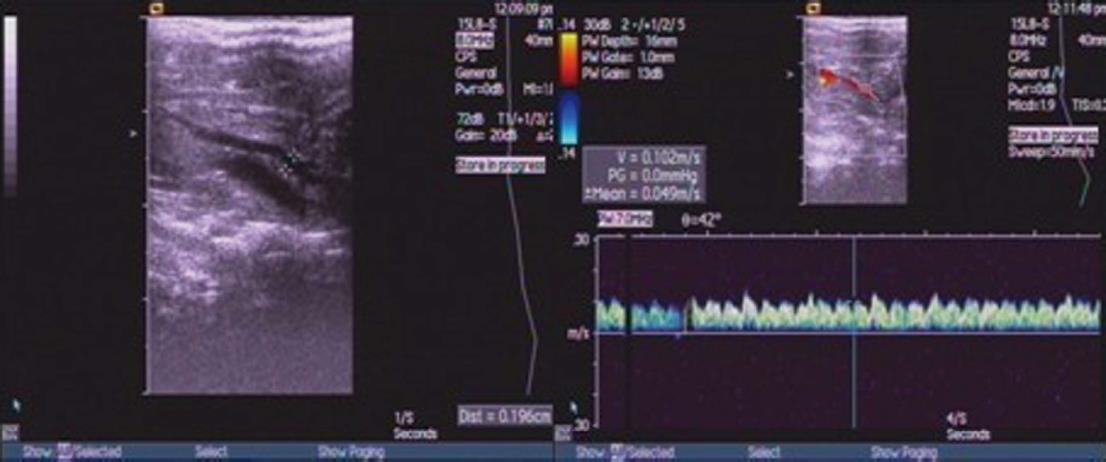
Figure 2 Measurement of hemodynamic parameter of portal vein.
Representative graphs for identifying portal vein and measurement of hemodynamic parameters using ultrasound.
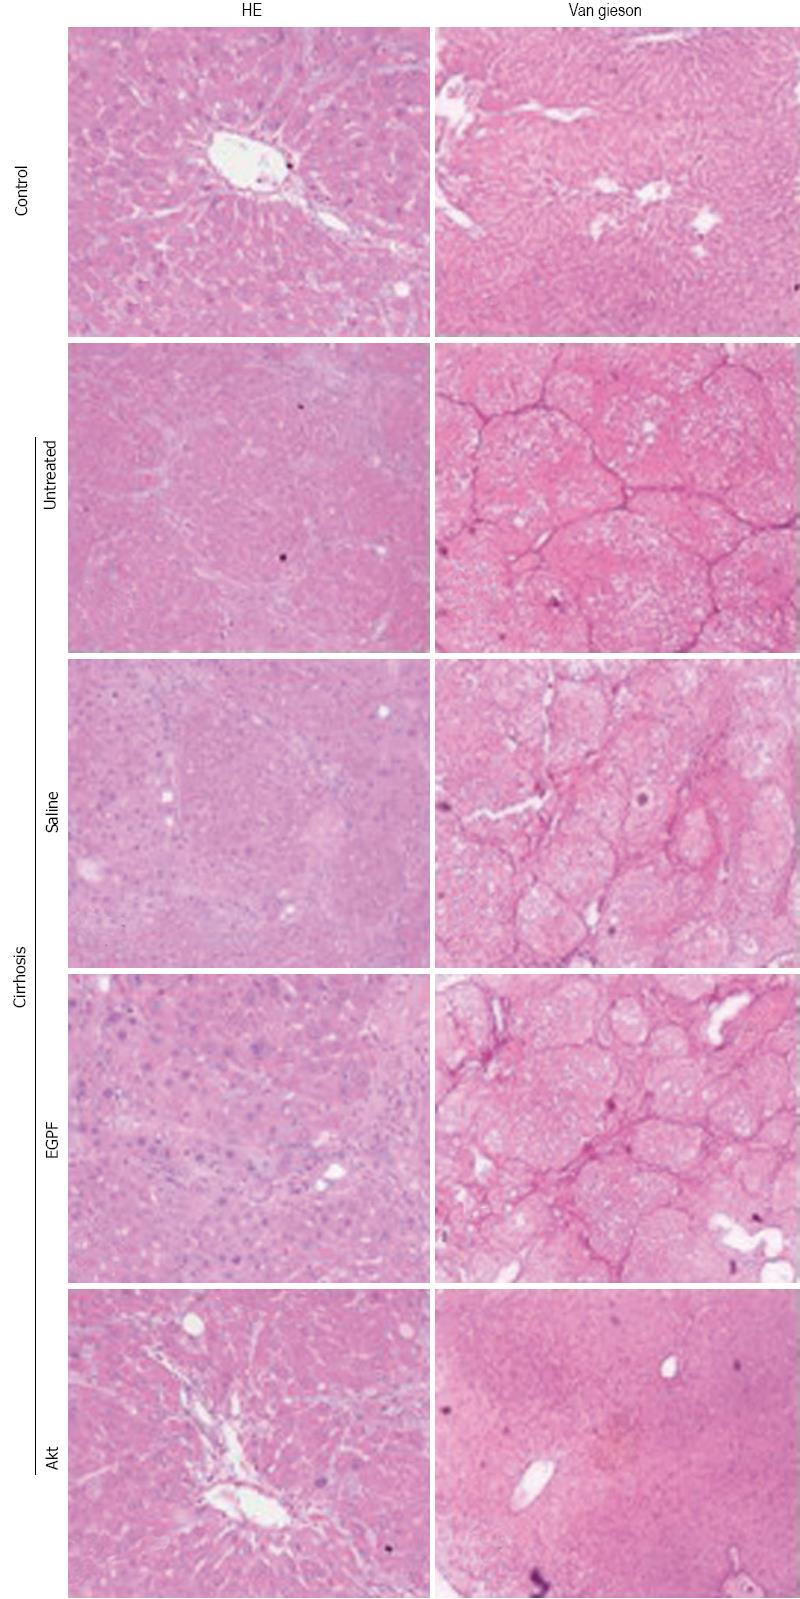
Figure 3 Histological changes in rat with cirrhosis induced by CCl4.
Livers from rats in each experimental group were collected 8 wk after CCl4 treatment, sectioned, and subjected to HE and van gieson staining for tissue structure and collagen deposition. While cirrhosis groups without treatment or received saline or ad-enhanced green fluorescent protein treatment show structure disruption and nodule formation as well as remarkable deposition of collagen, cirrhosis group with Akt virus transfer show well preserved tissue structure and less collagen, both of which are comparable to normal control (magnification × 100).
Figure 4 Flow cytometry analysis for hepatocyte apoptosis in each experimental group.
Single hepatocytes from each experiment groups were prepared at 2 wk after CCl4 treatment, and subjected to double staining of Propidium iodide (PI) and Annenin V to detect the dead and apoptotic cell. Representative data from each group are shown with designated name. Double positive cell with PI and Annenin V were considered as apoptotic dead cells and its percentage is listed in the right upper quadrant of the plot.
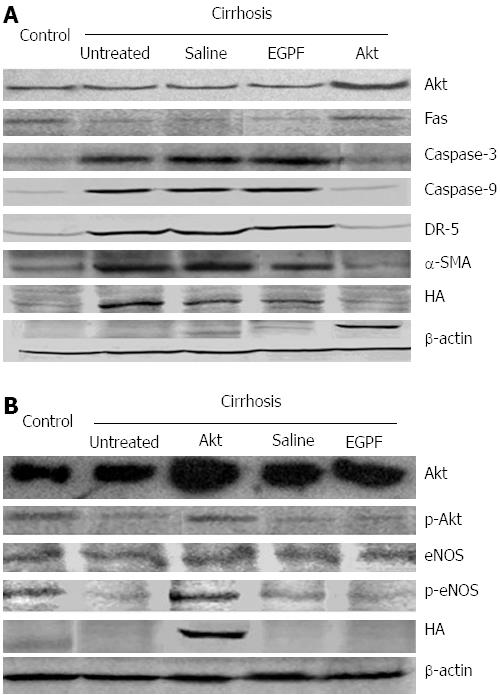
Figure 5 Western blotting analysis for apoptotic mediators and activation of hepatic stellate cells and endothelial nitric oxide synthase level.
A: Apoptotic mediators and activation of HSC; Liver tissue from each group of rats were homogenized and subjected to measurement for the levels of Akt, phosphorylated Akt (p-Akt), Fas, Caspase-9 and Caspase-3, and HSC activation markers, DR5 and α-SMA, as designated in the figure. B: eNOS level; Liver tissues from each group of rats were homogenized and subjected to the measurements for Akt, pAkt, eNOS and phosphorylated eNOS (p-eNOS). Blotting of HA was used to confirm the expression of recombinant HA-Akt protein, and β-actin was used for the loading control. Data are representative of 3 experiments. HSC: Hepatic stellate cells; eNOS: Endothelial nitric oxide synthase.
- Citation: Deng G, Huang XJ, Luo HW, Huang FZ, Liu XY, Wang YH. Amelioration of carbon tetrachloride-induced cirrhosis and portal hypertension in rat using adenoviral gene transfer of Akt. World J Gastroenterol 2013; 19(43): 7778-7787
- URL: https://www.wjgnet.com/1007-9327/full/v19/i43/7778.htm
- DOI: https://dx.doi.org/10.3748/wjg.v19.i43.7778


