Copyright
©2013 Baishideng Publishing Group Co.
World J Gastroenterol. Nov 21, 2013; 19(43): 7726-7734
Published online Nov 21, 2013. doi: 10.3748/wjg.v19.i43.7726
Published online Nov 21, 2013. doi: 10.3748/wjg.v19.i43.7726
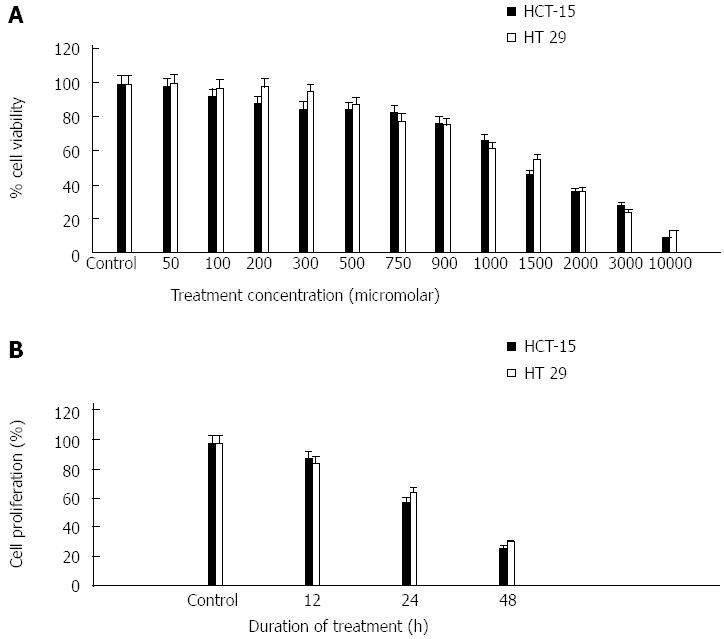
Figure 1 Antiproliferative effect, colony inhibitory of p-Coumaric acid against colon cancer cells.
A: Both human colorectal carcinoma (HCT-15) and HT-29 cells grown in 96-well plate were treated with various concentration of p-Coumaric acid (0-10000 μmol/L) diluted in the media for 48 h. The mean of the percentage cell viability (% of control) along with their standard error is indicated; B: After various incubation periods of p-Coumaric acid treatment, colonies formed were stained with 0.5% crystal violet and counted, and percentage of survival was calculated by normalizing the values. Data reported as the mean ± SE from three different observations. Mean differences are significant at 12, 24 and 48 h.
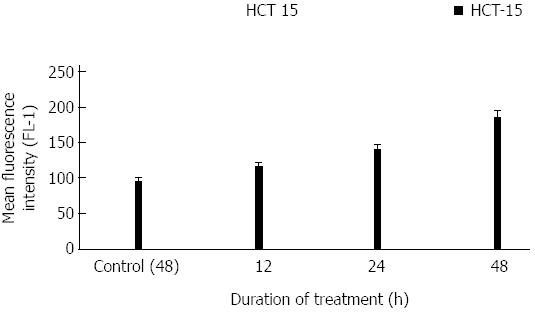
Figure 2 p-Coumaric acid induced reactive oxygen species generation.
Human colorectal carcinoma (HCT-15) cells were cultured in the presence or absence of p-Coumaric acid for the specified time points. Dichlorofluorescein-diacetate fluorescence intensity was detected by using flow cytometry. Data is representative of three independent experiments and the mean differences are significant at 12, 24 and 48 h.
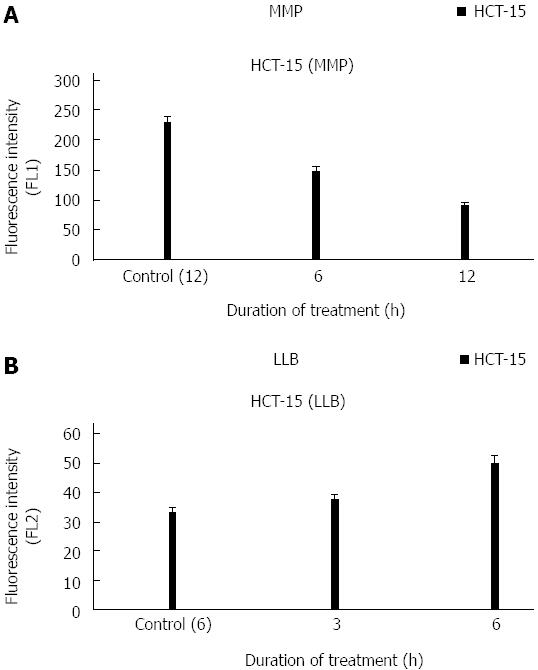
Figure 3 Events associated with growth-inhibitory effect of p-Coumaric acid.
A: Human colorectal carcinoma (HCT-15) cells were treated with p-Coumaric acid for specified time-periods and then mitochondrial membrane potential were determined using rhodamine-123 by flow cytometry. Mean differences are significant at 6 and 12 h compared with untreated control cells (P < 0.05 vs untreated control cells); B: HCT 15 cells were treated with p-Coumaric acid and evaluated using merocyanine 540 to quantify the lipid layer breaks (LLBs). Data is representative of three independent experiments and mean differences are significant at 3 and 6 h compared with untreated control cells (P < 0.05 vs untreated control cells). MMP: Mitochondrial membrane potential.
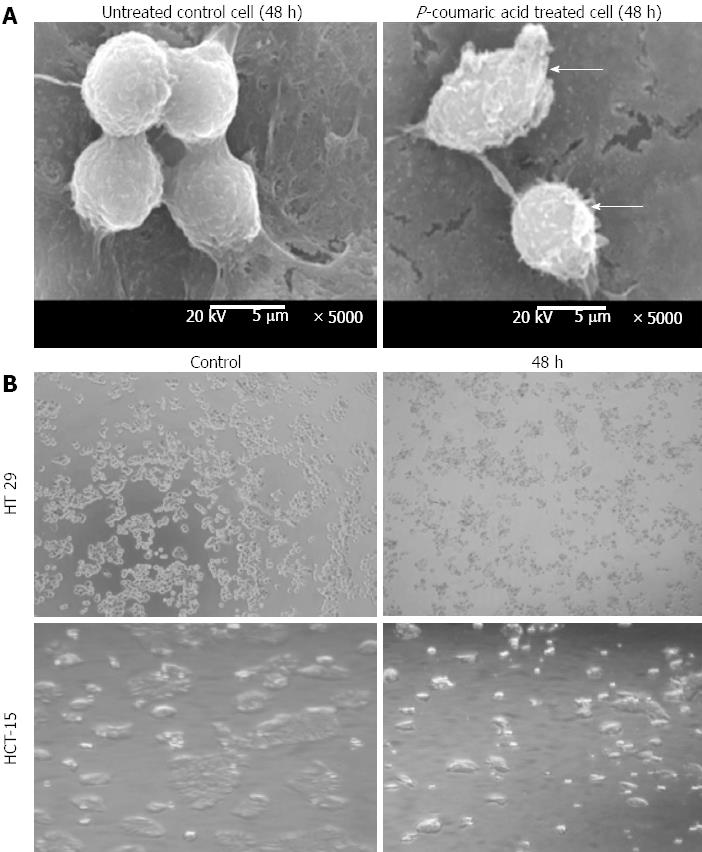
Figure 4 Morphological assessment of p-Coumaric acid treated cells.
A: Human colorectal carcinoma (HCT-15) cells were treated with p-Coumaric acid for 48 h and the cells were observed under scanning electron microscope. Treated cells showed membrane blebbing and shrinkage compared to untreated normal control cells; B: HT 29 and HCT 15 cells were subjected to p-Coumaric acid treatment for 48 h and observed under light microscopy. Treated cells displayed apoptotic features like blebbing and shrinkage compared to untreated normal control cells.
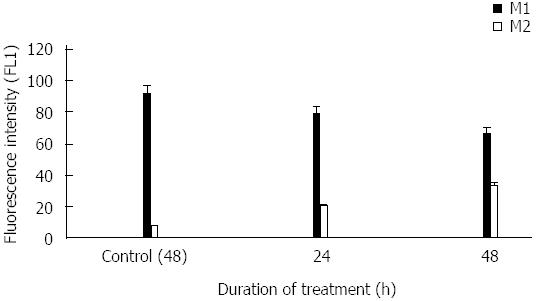
Figure 5 Apoptosis evaluation using Yo-Pro-1 dye by flow cytometry.
Human colorectal carcinoma (HCT-15) cells were treated with p-Coumaric acid for specified time points. The distribution of cell population changed according to the exposure time as indicated by M1 and M2. Percentage of M2 population depicting apoptosis increased on the basis of the duration of treatment. Data is representative of three independent experiments and the differences in the values of M2 were significant at 24 and 48 h (P < 0.05 vs untreated control cells) compared to untreated control cells.
-
Citation: Jaganathan SK, Supriyanto E, Mandal M. Events associated with apoptotic effect of
p -Coumaric acid in HCT-15 colon cancer cells. World J Gastroenterol 2013; 19(43): 7726-7734 - URL: https://www.wjgnet.com/1007-9327/full/v19/i43/7726.htm
- DOI: https://dx.doi.org/10.3748/wjg.v19.i43.7726


