Copyright
©2013 Baishideng Publishing Group Co.
World J Gastroenterol. Nov 14, 2013; 19(42): 7480-7486
Published online Nov 14, 2013. doi: 10.3748/wjg.v19.i42.7480
Published online Nov 14, 2013. doi: 10.3748/wjg.v19.i42.7480
Figure 1 Hepatic adenomas associated with glycogen storage disease type Ia.
A: Gd-EOB-DTPA enhanced axial T1-weighted image on arterial phase (left upper) reveals approximately 2 cm intense enhancing mass in the segment 3 of liver (black arrows). The mass shows nearly iso-signal intensity with capsular enhancement on 3 min delayed phase (right upper), intermediate high signal intensity on axial T2-weighted image (left lower), and clear defect on 20 min hepatobiliary phase (right lower); B: Approximately 1.8 cm sized intense enhancing mass on arterial phase (left upper) is noted in the segment 6 of liver. This mass shows suspicious focal eccentric wash-out enhancement (white arrows) on 3 min delayed phase (right upper). This portion reveals relatively low signal intensity on axial T2-weighted image (left lower) and 20 min hepatobiliary phase (right lower), compared to other tumor area. Surrounding rim enhancement in the tumor is seen on 20 min hepatobiliary phase; C: Approximately 1.8 cm arterial enhancing mass (white arrows) is seen in the segment 2 of liver. The mass reveals slightly high signal intensity on 3 min delayed phase (right upper), intermediate high signal intensity on axial T2-weighted image (left lower), and fuzzy defect on 20 min hepatobiliary phase (right lower). Multifocal arterioportal shunts (asterisks) are noted in the segments 3 and 7 of liver; D: Approximately 1.8 cm sized intense enhancing mass (black arrows) on arterial phase (left upper) is noted in the segment 6 of liver. This mass shows slightly high signal intensity with capsular enhancement on 3min delayed phase (right upper), and intermediate high signal intensity on axial T2-weighted image (left lower). On 20 min hepatobiliary phase (right lower), the tumor reveals clear defect with surrounding rim enhancement. Gd-EOB-DTPA: Gadolinium ethoxybenzyl diethylene triamine pentaacetic acid.
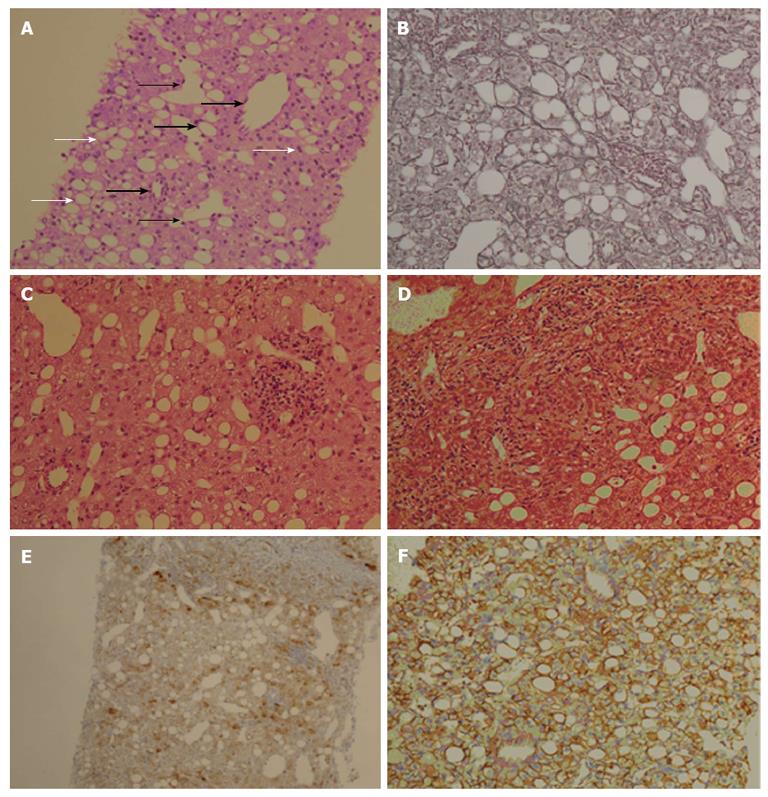
Figure 2 The histological features are consistent with the inflammatory type of hepatocellular adenoma.
A: A hepatocellular adenoma in GSD-Ia has several unpaired arteries (thick black arrows), sinusoidal dilation (thin black arrows), and steatosis (white arrows), but the atypia of hepatocytes are low without a nuclear pleomorphism; B: A reticulin staining does not show thick hepatic cords; C: The lymphocytic infiltrates are found in a hepatic lobule; D: The lymphocytes infiltrate in the area surrounded a portal and a periportal tracts; E: Staining for glutamine synthetase is diffuse cytoplasmic with focal nuclear expression; F: β-catenin staining does not show abnormal expression. GSD-Ia: Glycogen storage disease type Ia.
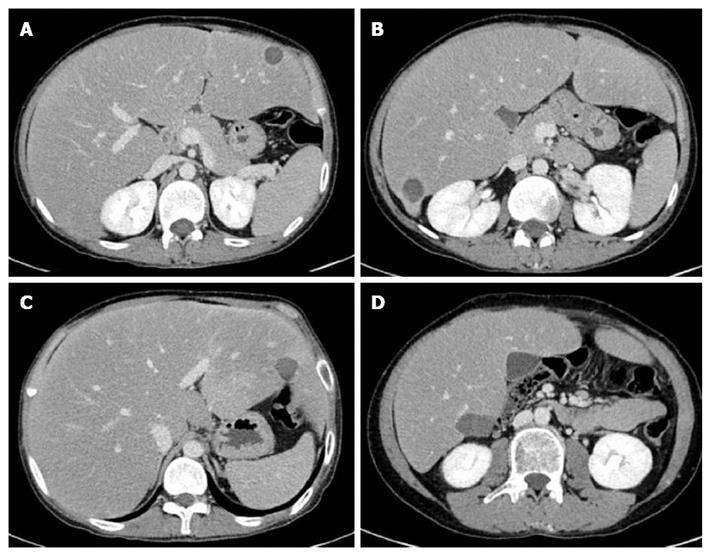
Figure 3 Computed tomogram follow-up after 3 mo showed gradual reduction of radiofrequency ablation zone.
A: Post-RFA follow-up CT revealed gradual contraction of ablated lesion in segment 3 to 1 cm; B: Complete ablation of enhancing lesion in segment 6 was observed in Post-RFA follow-up CT; C: Post-RFA follow-up CT showed complete ablation of 1.8 cm sized tumor in segment 2; D: Post-RFA CT revealed no residual lesion without adjacent organ damage. CT: Computed tomogram; RFA: Radiofrequency ablation.
- Citation: Ahn SY, Park SY, Kweon YO, Tak WY, Bae HI, Cho SH. Successful treatment of multiple hepatocellular adenomas with percutaneous radiofrequency ablation. World J Gastroenterol 2013; 19(42): 7480-7486
- URL: https://www.wjgnet.com/1007-9327/full/v19/i42/7480.htm
- DOI: https://dx.doi.org/10.3748/wjg.v19.i42.7480


