Copyright
©2013 Baishideng Publishing Group Co.
World J Gastroenterol. Nov 14, 2013; 19(42): 7440-7446
Published online Nov 14, 2013. doi: 10.3748/wjg.v19.i42.7440
Published online Nov 14, 2013. doi: 10.3748/wjg.v19.i42.7440
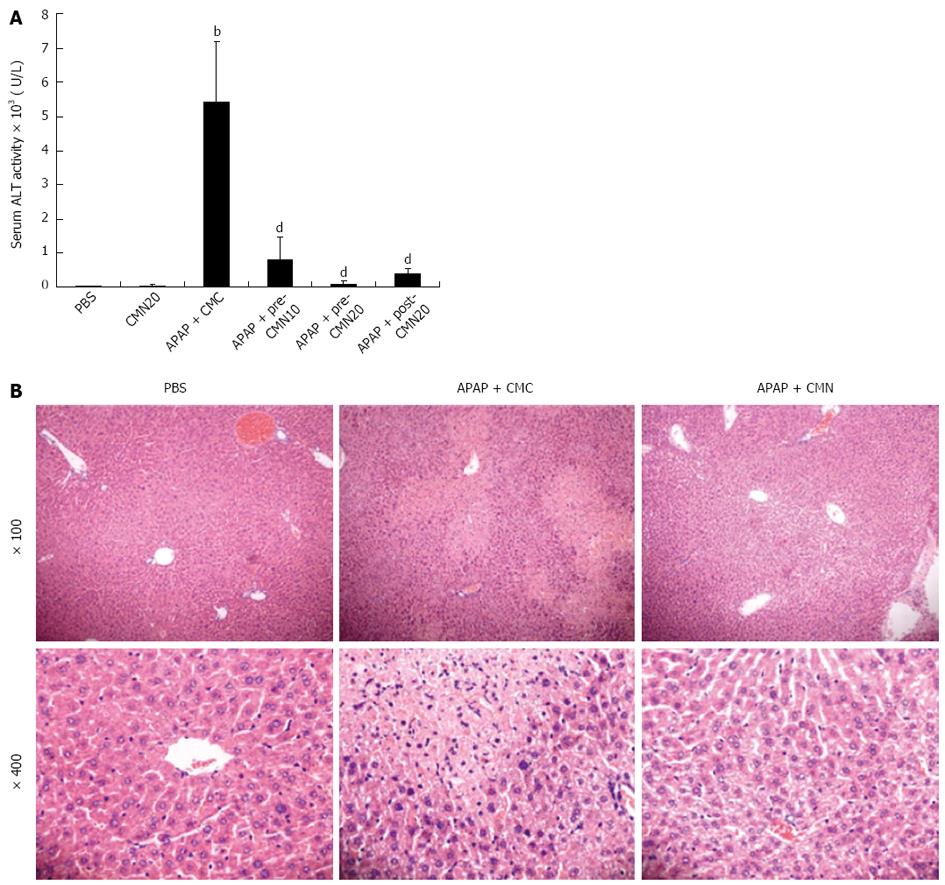
Figure 1 Curcumin treatment protects against acetaminophen-induced hepatic injury in mice.
A: Serum alanine aminotransferase (ALT) levels were determined 16 h after acetaminophen injection. Data are expressed as mean ± SE; n = 10 mice per group. bP < 0.01 vs control; dP < 0.001 vs acetaminophen (APAP) + carboxymethylcellulose (CMC); B: Hematoxylin-eosin stained liver sections from animals treated with PBS, APAP + CMC and APAP + CMN (original magnification: ×100 and ×400). Severe inflammatory cell infiltration and gross necrosis of the entire centrilobular areas were obvious in APAP group, and the results were significantly ameliorated in CMN-treated animals. CMN: Curcumin.
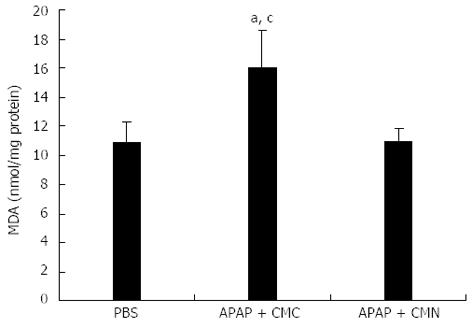
Figure 2 Curcumin pretreatment inhibits malondialdehyde production after acetaminophen induction.
Liver homogenate was prepared to analyze the content of malondialdehyde (MDA) 16 h after acetaminophen (APAP) administration. Data are expressed as mean ± SE; n = 10 mice per group. aP < 0.05 vs control; cP < 0.05 vs APAP + curcumin (CMN). CMC: Carboxymethylcellulose.
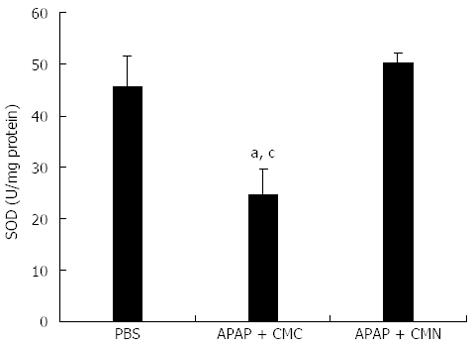
Figure 3 Curcumin pretreatment enhances activity of superoxide dismutase after acetaminophen.
Liver homogenate was prepared to analyze the activity of superoxide dismutase (SOD) 16 h after acetaminophen (APAP) administration. Data are expressed as mean ± SE; n = 10 mice per group. aP < 0.05 vs control; cP < 0.05 vs APAP + curcumin (CMN). CMC: Carboxymethylcellulose.
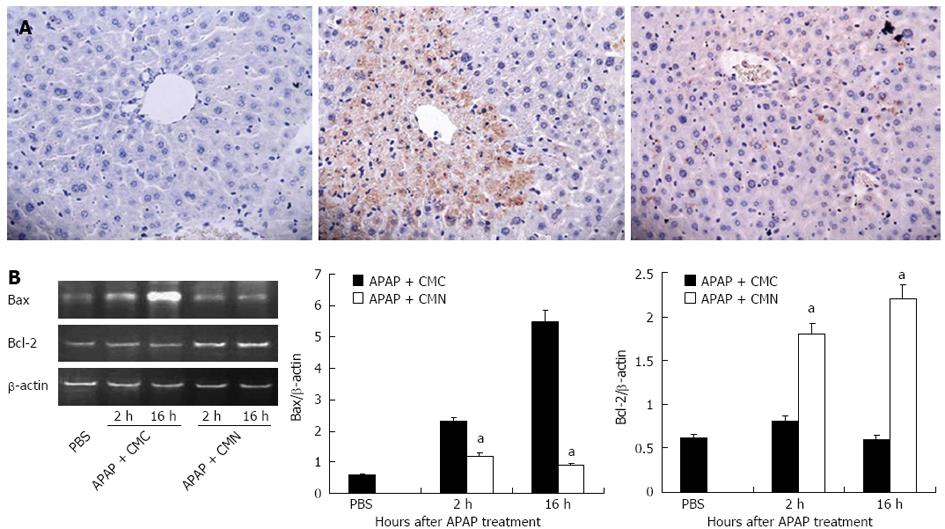
Figure 4 Curcumin pretreatment prevents hepatocyte apoptosis induced by acetaminophen.
A: Transferase-mediated dUTP-biotin nick end labeling stained liver sections from animals treated with PBS, acetaminophen (APAP) + carboxymethylcellulose (CMC) and APAP + curcumin (CMN) (original magnification: × 400); B: Liver samples were collected 2 h and 16 h after APAP injection, and the mRNA expression of Bax and Bcl2 was determined by reverse transcriptase polymerase chain reaction. Data are expressed as mean ± SE; n = 6 mice per group. aP < 0.05 vs APAP + CMC.
- Citation: Li G, Chen JB, Wang C, Xu Z, Nie H, Qin XY, Chen XM, Gong Q. Curcumin protects against acetaminophen-induced apoptosis in hepatic injury. World J Gastroenterol 2013; 19(42): 7440-7446
- URL: https://www.wjgnet.com/1007-9327/full/v19/i42/7440.htm
- DOI: https://dx.doi.org/10.3748/wjg.v19.i42.7440


