Copyright
©2013 Baishideng Publishing Group Co.
World J Gastroenterol. Oct 7, 2013; 19(37): 6284-6291
Published online Oct 7, 2013. doi: 10.3748/wjg.v19.i37.6284
Published online Oct 7, 2013. doi: 10.3748/wjg.v19.i37.6284
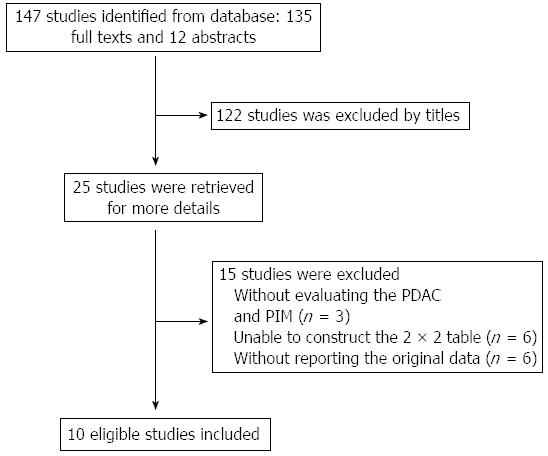
Figure 1 Literature search flow diagram.
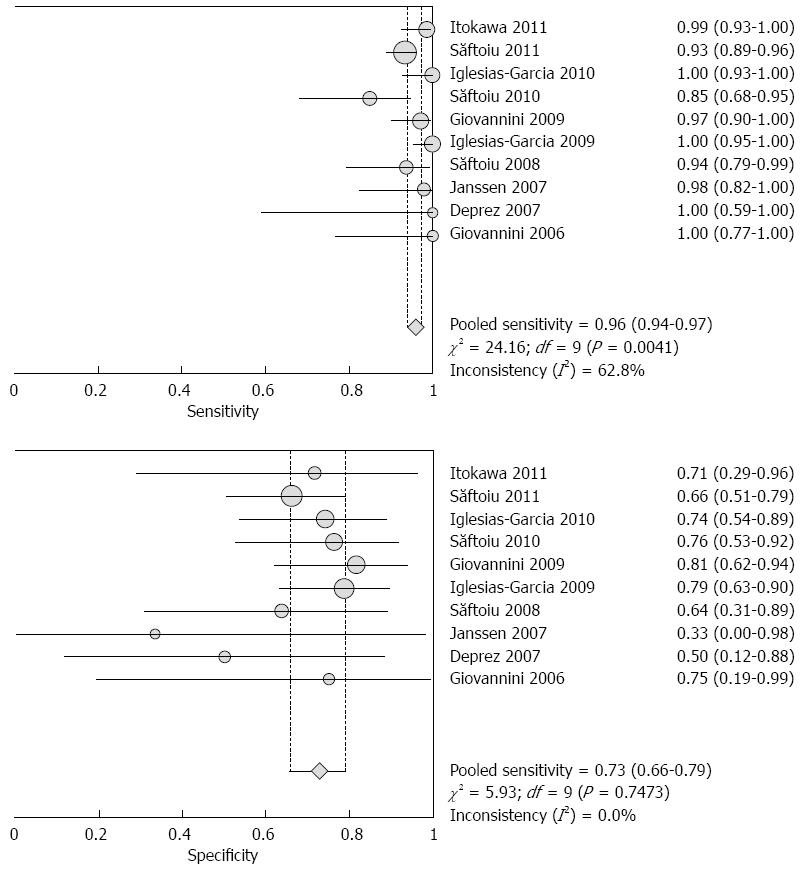
Figure 2 Forest plot (random-effect model) of the meta-analysis for sensitivity (upper) and specificity (lower) in differentiating between pancreatic ductal adenocarcinoma and pancreatic inflammatory masses.
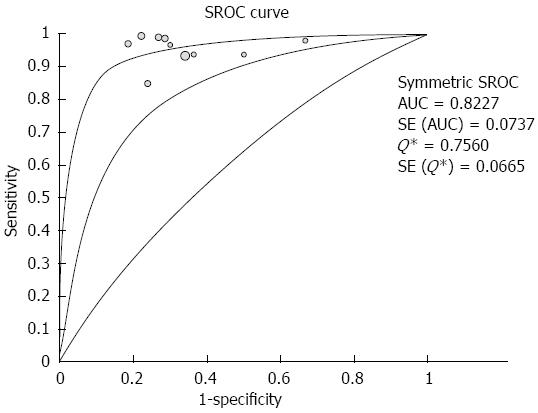
Figure 3 Sports Rights Owners Coalition, with 95%CI, for differentiating between pancreatic ductal adenocarcinoma and pancreatic inflammatory masses.
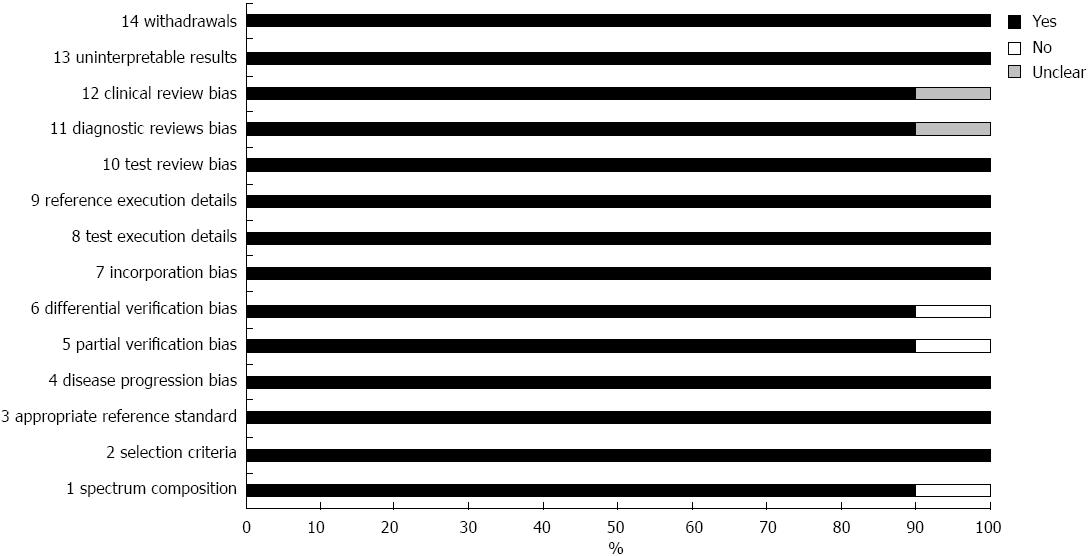
Figure 4 The Quality Assessment of Diagnostic Accuracy Studies scores of the selected studies are summed up per item and presented in a bar chart.
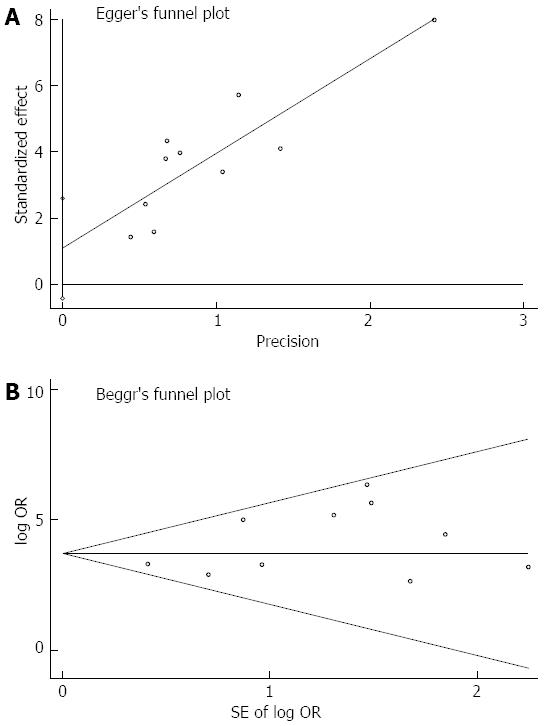
Figure 5 Funnel plots.
A: Funnel plot of the Harbord-Egger indicator for the selected studies; B: Funnel plot of the Begg-Mazumdar indicator for the selected studies.
- Citation: Li X, Xu W, Shi J, Lin Y, Zeng X. Endoscopic ultrasound elastography for differentiating between pancreatic adenocarcinoma and inflammatory masses: A meta-analysis. World J Gastroenterol 2013; 19(37): 6284-6291
- URL: https://www.wjgnet.com/1007-9327/full/v19/i37/6284.htm
- DOI: https://dx.doi.org/10.3748/wjg.v19.i37.6284


