Copyright
©2013 Baishideng Publishing Group Co.
World J Gastroenterol. Oct 7, 2013; 19(37): 6178-6187
Published online Oct 7, 2013. doi: 10.3748/wjg.v19.i37.6178
Published online Oct 7, 2013. doi: 10.3748/wjg.v19.i37.6178
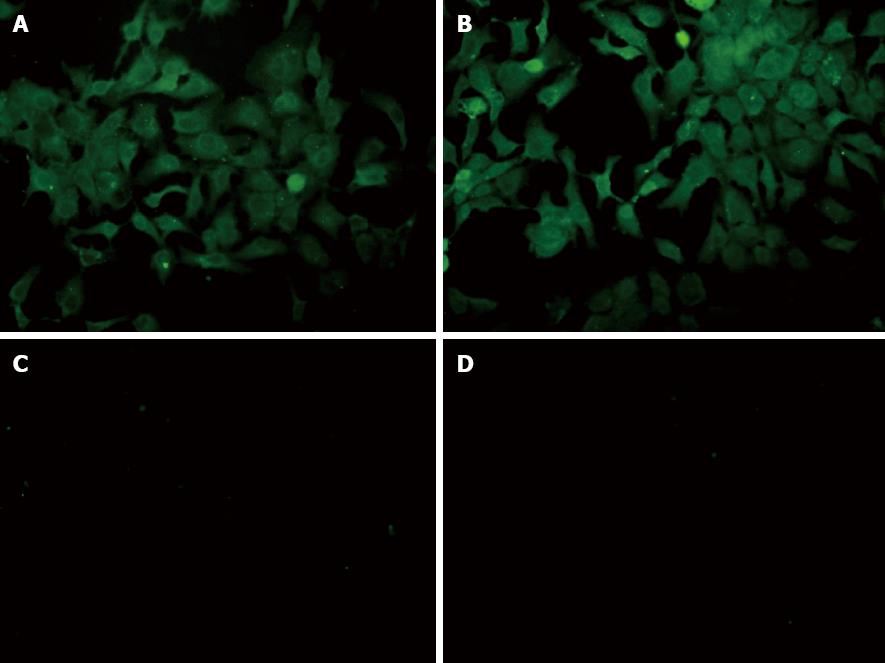
Figure 1 Indirect immunofluorescence detection of hepatitis C virus core proteins (400 ×).
A: Huh-7-HCV cells appeared bright green fluorescent, they are HCV core proteins which were labeled with GFP; B: Huh-7.5-HCV cells appeared bright green fluorescent, they are HCV core proteins which were labeled with GFP; C and D: In Huh-7 and Huh-7.5 control cells, there were no green fluorescent, HCV core proteins were not expressed in them.
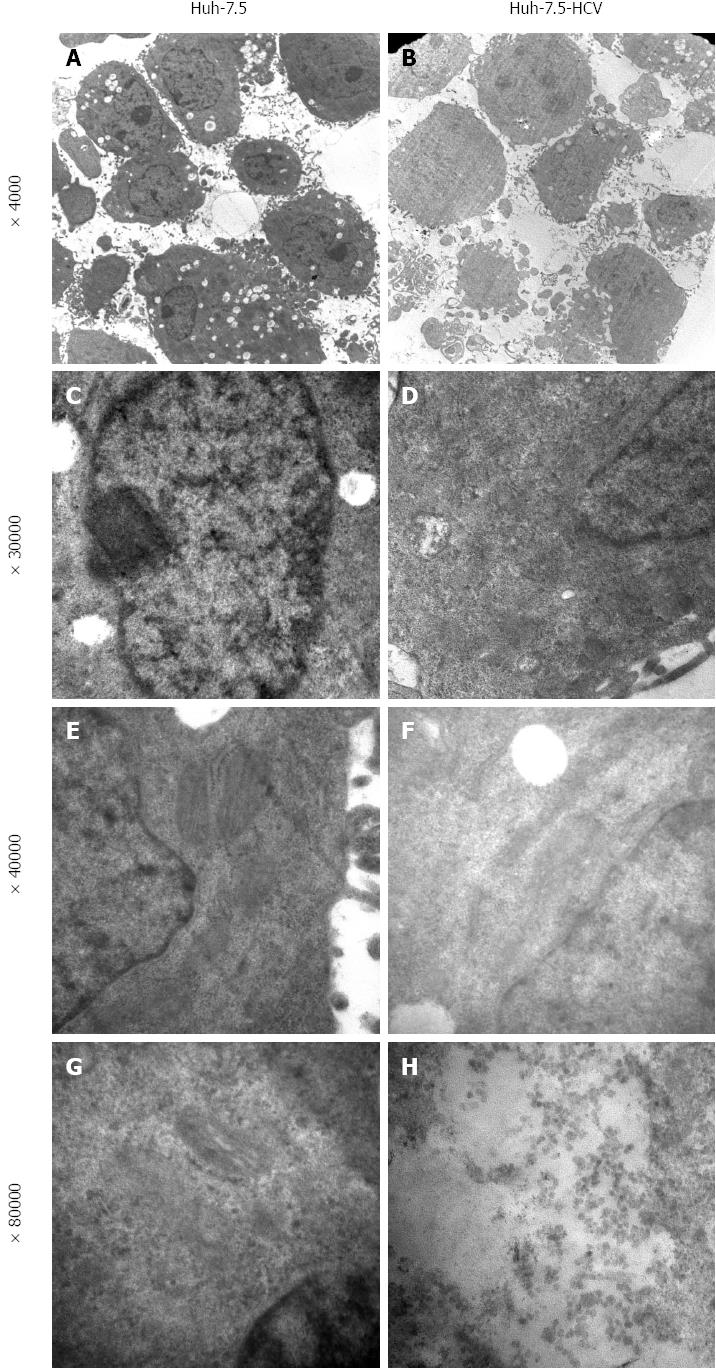
Figure 2 Transmission electron microscopy of hepatitis C virus-transfected Huh7.
5 cells (× 4000, × 30000, × 40000, × 80000). A, C, E, G: Control human hepatoma cells, no virus-like particles, mitochondrial and endoplasmic reticulum are normal; B, D, F, H: HCV-transfected human hepatoma cells, human hepatoma cells have large deformed nuclei, and cultured cells prone to exist large vacuoles; D shows mitochondrial swelling and cristae disappearance; F shows the rough endoplasmic reticulum increased; H shows spherical structures of electron density, diameter is between 30-50 nm.
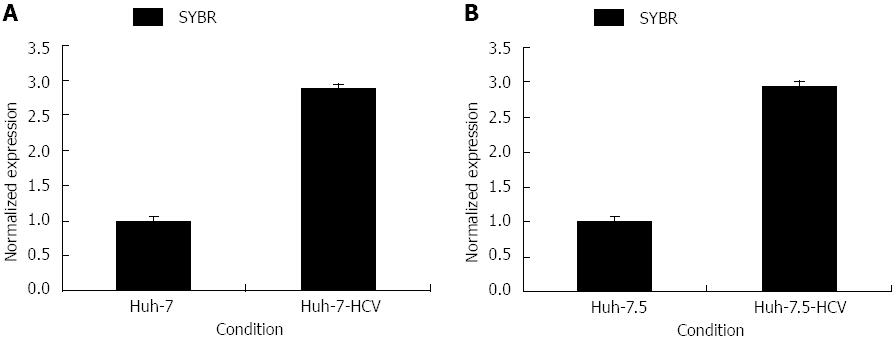
Figure 3 Relative cytokeratin 8 mRNA expression in Huh-7 and Huh-7- hepatitis C virus cells (A), or Huh-7.
5 and Huh-7.5- hepatitis C virus cells (B).
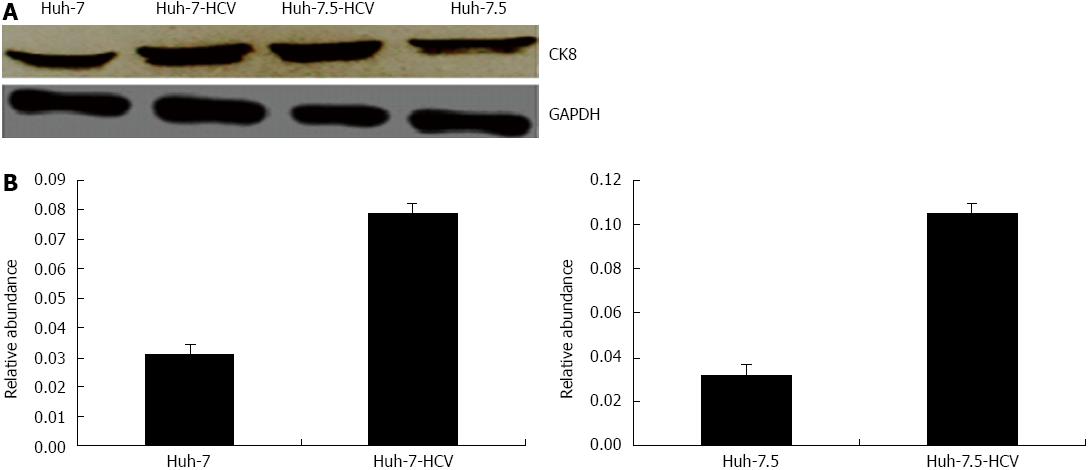
Figure 4 Cytokeratin 8 expression determined at the protein level by Western blotting.
A: CK8 expression in Huh-7, Huh-7-HCV cells, Huh-7.5 and Huh-7.5-HCV cells; B: Relative CK8 expression normalized to GAPDH. HCV: Hepatitis C virus; CK8: Cytokeratin 8; GAPDH: Glyceraldehydes-3-phosphate dehydrogenase.
Figure 5 Inverted fluorescence microscopic observation 24 h after cytokeratin 8 transfection (× 200).
A: SMMC7721 cells transfected by pEGFP-CK8 recombination vector; B: SMMC7721 cells transfected by pEGFP-C1 vector; C: SMMC7721 cells without transfection. CK8: Cytokeratin 8.
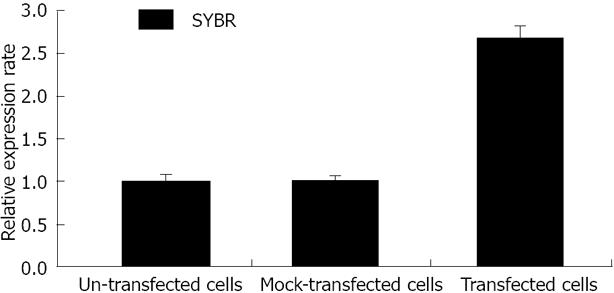
Figure 6 Cytokeratin 8 relative expression at the mRNA level.
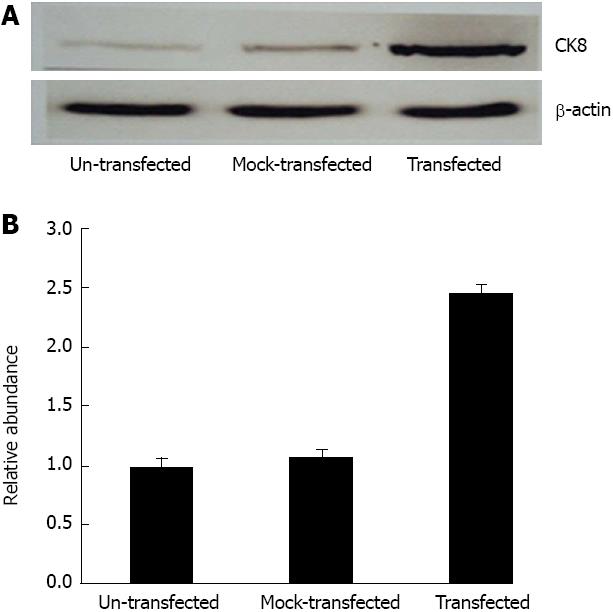
Figure 7 Cytokeratin 8 expression at the protein level 48h after transfection.
CK8: Cytokeratin 8.
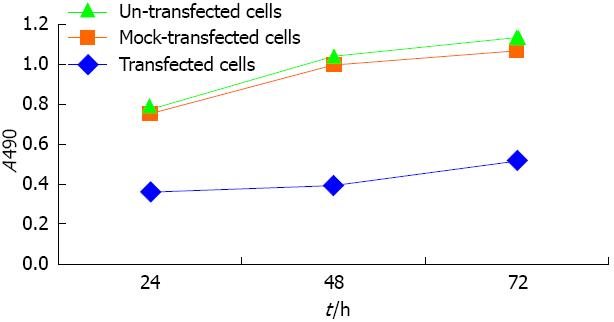
Figure 8 Growth chart after transfection in three groups of cells.
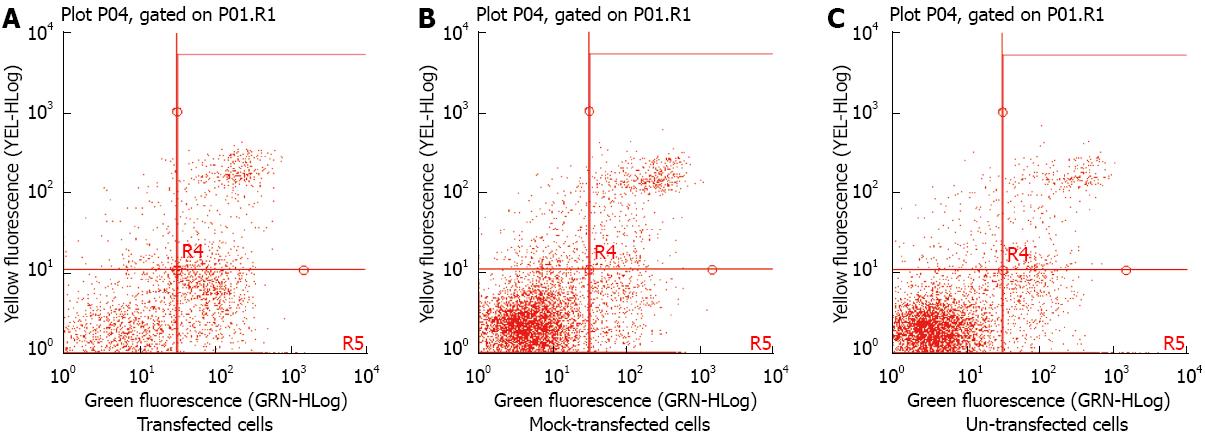
Figure 9 Cell flow cytometry.
A: SMMC7721/ pEGFP-cytokeratin 8 cells; B: SMMC7721/ pEGFP-C1 cells; C: SMMC7721 cells without transfection. Cells were collected and washed twice with PBS, suspended in 200 μL binding buffer and 10 μL annexin V-FITC for 20 min in the dark, and thereafter, 300 μL binding buffer and 5 μL propidium iodide (PI) were added to each sample. The apoptotic cells were determined using a flow cytometer by staining with Annexin V-FITC. Representative dot plots show annexin V-FITC staining in cells. Results are representative of 3 independent experiments. FITC: Fluorescein isothiocyanate; PBS: Phosphate-buffered saline.
- Citation: Sun MZ, Dang SS, Wang WJ, Jia XL, Zhai S, Zhang X, Li M, Li YP, Xun M. Cytokeratin 8 is increased in hepatitis C virus cells and its ectopic expression induces apoptosis of SMMC7721 cells. World J Gastroenterol 2013; 19(37): 6178-6187
- URL: https://www.wjgnet.com/1007-9327/full/v19/i37/6178.htm
- DOI: https://dx.doi.org/10.3748/wjg.v19.i37.6178


