Copyright
©2013 Baishideng Publishing Group Co.
World J Gastroenterol. Aug 21, 2013; 19(31): 5111-5117
Published online Aug 21, 2013. doi: 10.3748/wjg.v19.i31.5111
Published online Aug 21, 2013. doi: 10.3748/wjg.v19.i31.5111
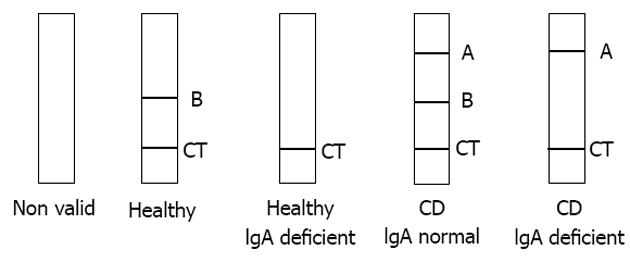
Figure 1 Celiac disease lateral-flow immunochromatographic assay visual result interpretation.
CT: Control line; A: Position for detection of IgA and IgG anti-DGP; B: Position for detection of total IgA; CD: Celiac disease; IgA: Immunoglobulin A.
Figure 2 Histogram showing the immunoglobulin A-tissue transglutaminase enzyme-linked immunosorbent assay and celiac disease lateral-flow immunochromatographic assay test results.
Text in gray indicates false-positive and false-negative results by celiac disease lateral-flow immunochromatographic assay (CD-LFIA). FDR: First-degree relatives; GFD: Gluten-free diet; Control: First-degree relatives and patients with celiac disease symptoms diagnosed as celiac disease (CD)-negative; IgA-tTG: Immunoglobulin A-tissue transglutaminase.
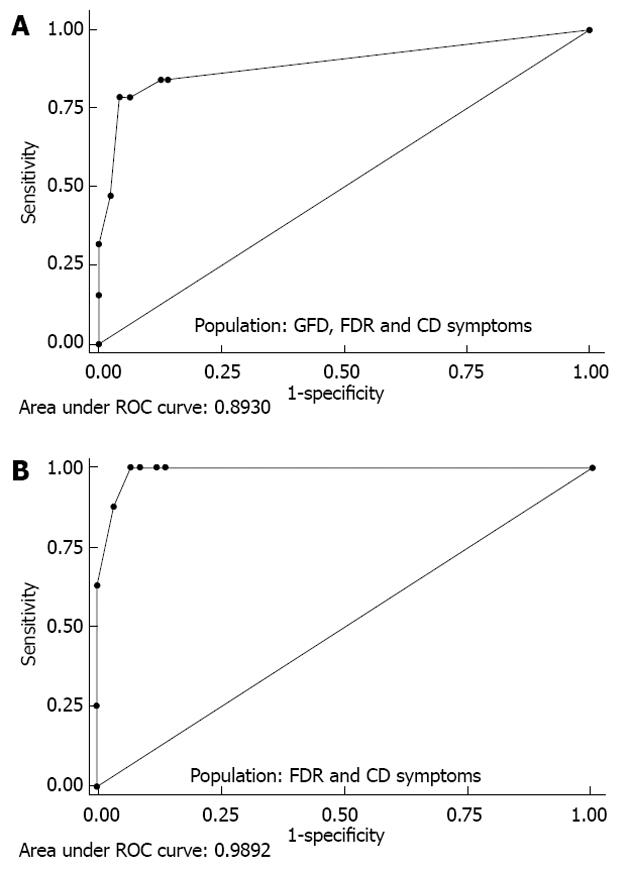
Figure 3 Diagnostic performance of the celiac disease lateral-flow immunochromatographic assay test determined by receiver operating characteristic curve analysis.
A: GFD, FDR and CD symptoms; B: FDR and CD symptoms. FDR: First-degree relatives; CD: Celiac disease symptoms; GFD: Gluten-free diet; ROC: Receiver operating characteristic.
- Citation: Benkebil F, Combescure C, Anghel SI, Besson Duvanel C, Schäppi MG. Diagnostic accuracy of a new point-of-care screening assay for celiac disease. World J Gastroenterol 2013; 19(31): 5111-5117
- URL: https://www.wjgnet.com/1007-9327/full/v19/i31/5111.htm
- DOI: https://dx.doi.org/10.3748/wjg.v19.i31.5111


