Copyright
©2013 Baishideng Publishing Group Co.
World J Gastroenterol. Aug 21, 2013; 19(31): 5076-5084
Published online Aug 21, 2013. doi: 10.3748/wjg.v19.i31.5076
Published online Aug 21, 2013. doi: 10.3748/wjg.v19.i31.5076
Figure 1 Photograph of the vascular anastomosis with the renal vein in the experimental group.
IVC: Inferior vena cava; MCS: Mesocaval shunt.
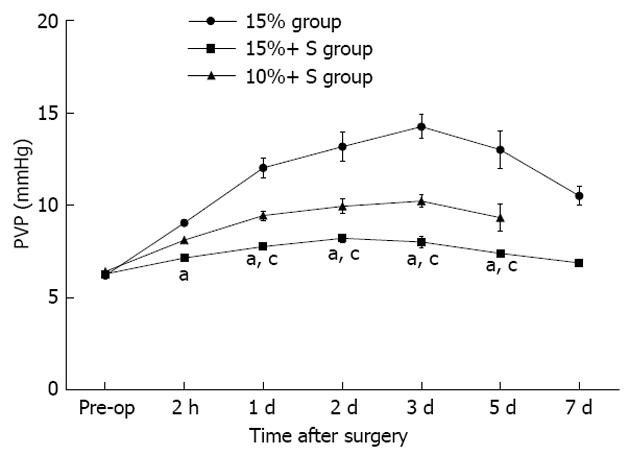
Figure 2 Serial changes in portal vein pressure in the three groups.
There was a significant difference in changes in portal vein pressure (PVP) among the three groups. aP < 0.05 vs 15% group; cP < 0.05 vs 10%+ S group.
Figure 3 Baseline values of hyaluronic acid among the three groups were not significantly different, but in the 15%+ S group it was significantly decreased at 1 and 3 d post-hepatectomy compared to that in the 15% group.
bP < 0.01 vs 10% group; dP < 0.01 vs 15% group. HA: Hyaluronic acid.
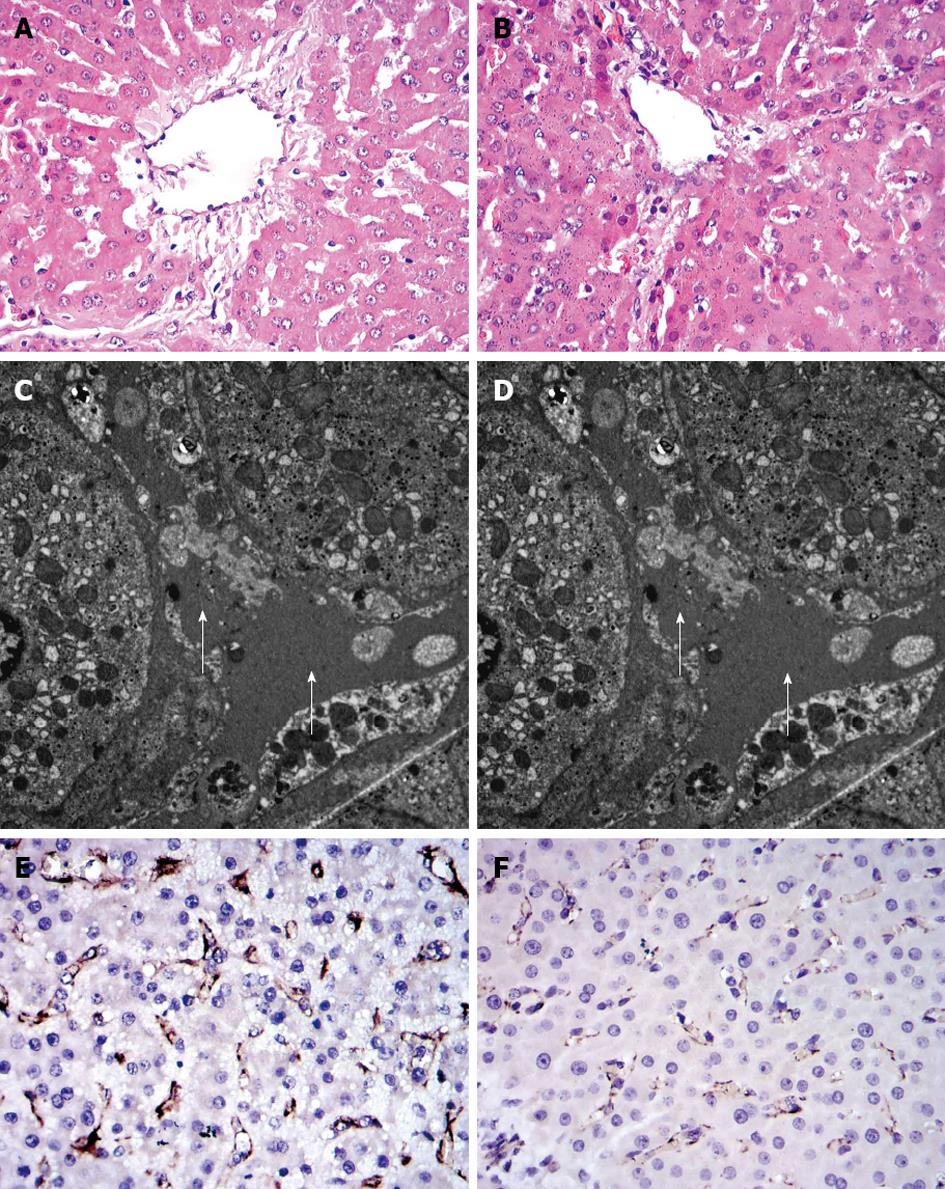
Figure 4 The histological changes in tissue samples were taken at 1 h post-hepatectomy in the three groups.
Hematoxylin and eosin (magnification × 400); Transmission electron microscopy (magnification × 6000) and CD31 immunohistochemical staining in the three groups. In the 15% group, there was significant endothelial denudation, sinusoidal dilation, hydropic changes in hepatocytes, and hemorrhage into the perivenular connective tissue (A); the sinusoidal endothelial lining was slightly damaged and detached into the sinusoidal space, with enlargement of the Disse’s spaces (C, arrow); CD31 immunostaining also revealed destruction of the endothelial lining (E); whereas in the 15%+ S or 10%+ S group, there was no intraparenchymal hemorrhage present (B); Transmission electron microscopy demonstrated the sinusoidal endothelial cells, and the structure of the endothelial lining can also be seen (arrow) (D); CD31 immunostaining also revealed mild sinusoidal microarchitecture injury (F).
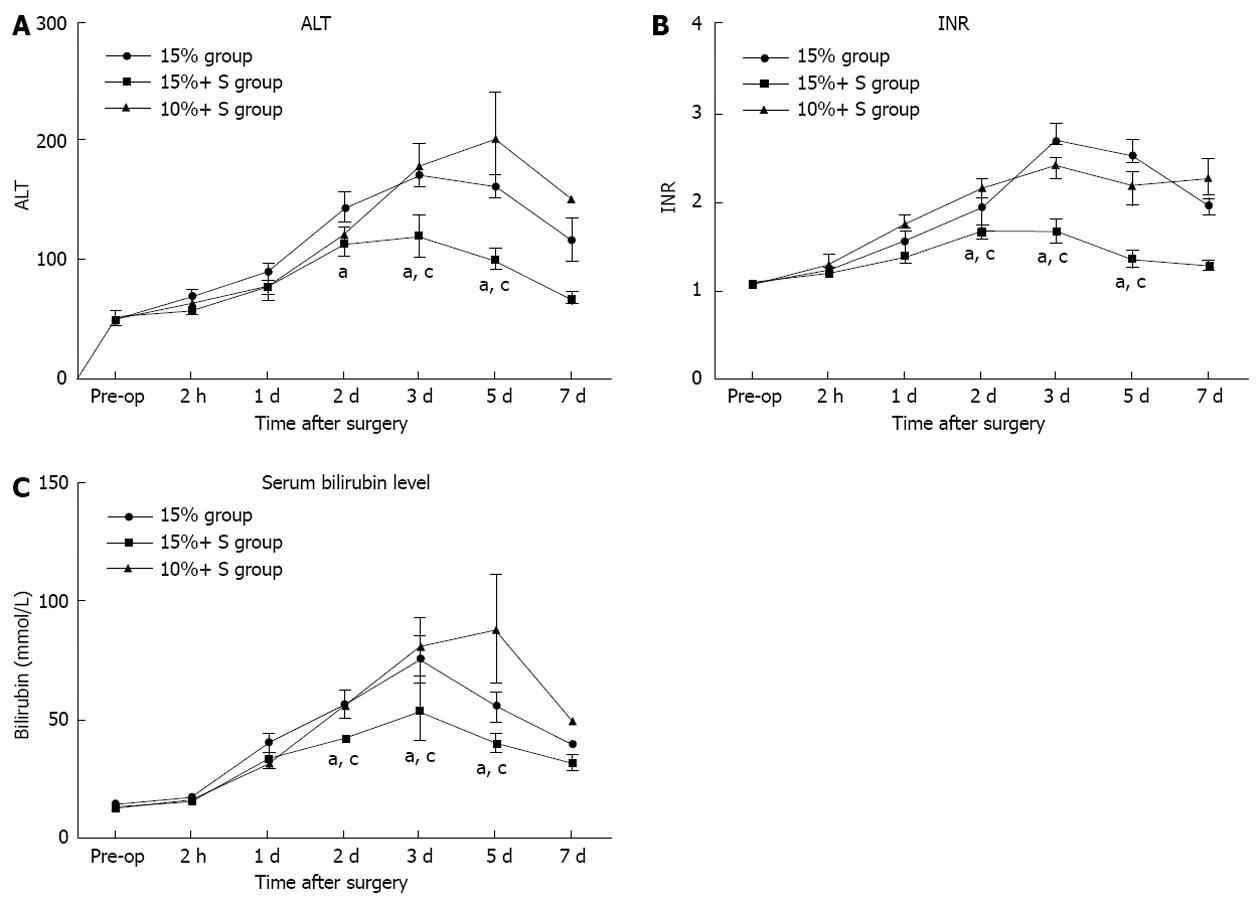
Figure 5 Changes in serum alanine aminotransferase and bilirubin level, and international normalized ratio in the three groups.
A: Serum alanine aminotransferase (ALT); B: International normalized ratio (INR); C: Serum bilirubin level. aP < 0.05 vs 15% group; cP < 0.05 vs 10%+ S group.
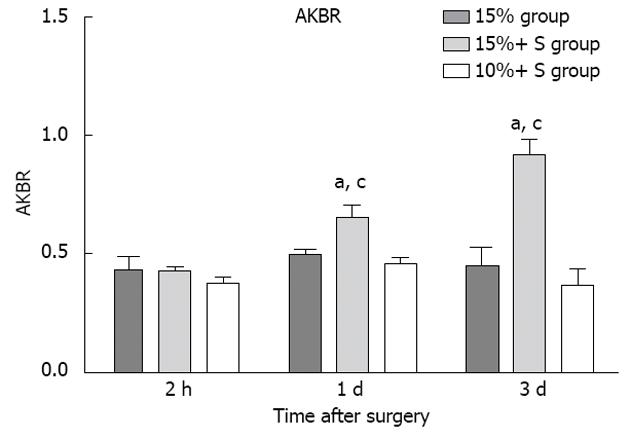
Figure 6 Changes in the arterial ketone body ratio level in the three groups.
aP < 0.05 vs 15% group; cP < 0.05 vs 10%+ S group. AKBR: Arterial ketone body ratio.
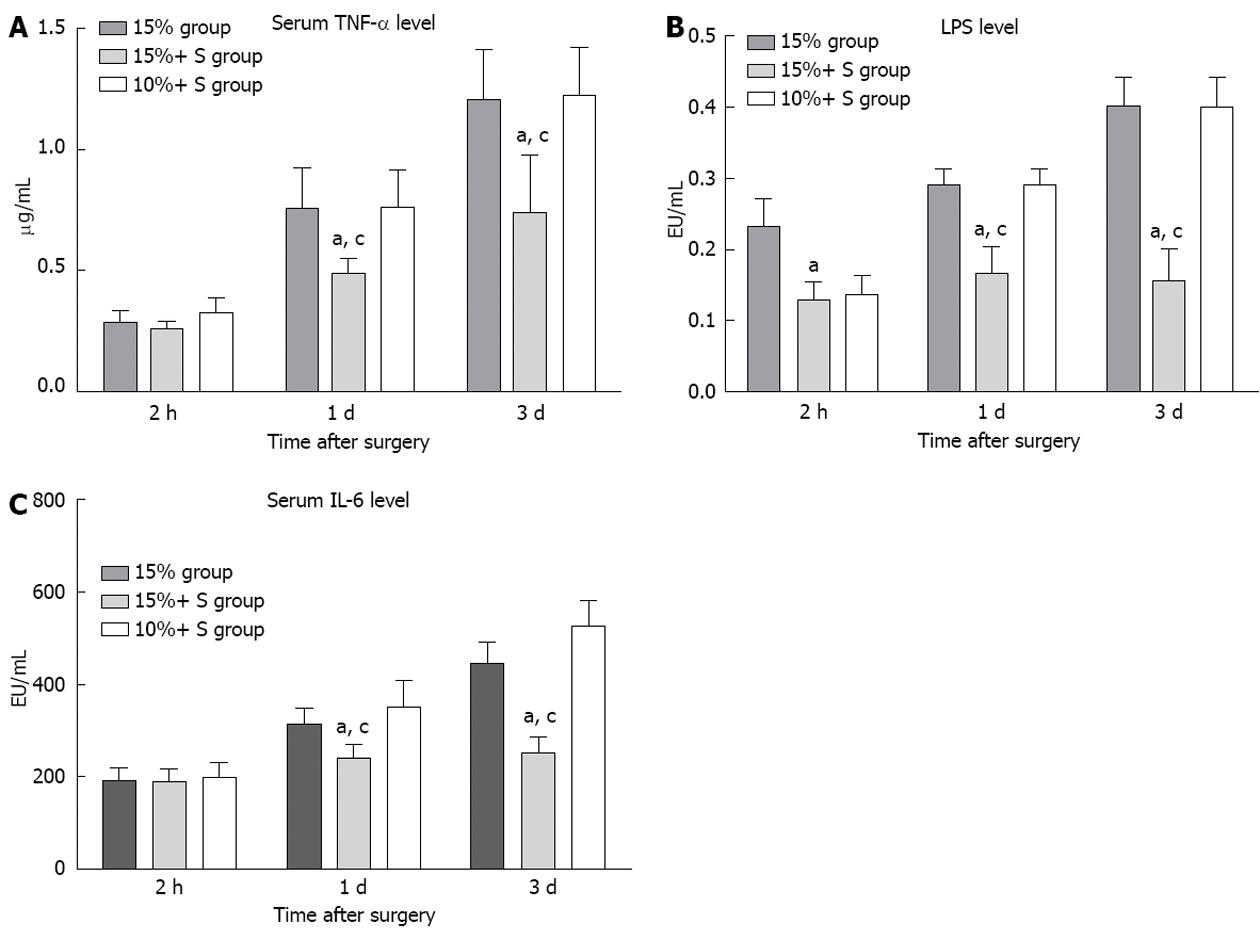
Figure 7 Serial changes in the serum lipopolysaccharides, tumor necrosis factor-α, and interleukin-6 level in three groups, in which significant differences were noted.
A: Serum level of tumor necrosis factor-α (TNF-α); B: Serum level of lipopolysaccharides (LPS); C: Serum level of interleukin-6 (IL-6). aP < 0.05 vs 15% group; cP < 0.05 vs 10%+ S group.
- Citation: Tu YL, Wang X, Wang DD, Zhu ZM, Tan JW. Impact of mesocaval shunt on safe minimal liver remnant: Porcine model. World J Gastroenterol 2013; 19(31): 5076-5084
- URL: https://www.wjgnet.com/1007-9327/full/v19/i31/5076.htm
- DOI: https://dx.doi.org/10.3748/wjg.v19.i31.5076


