Copyright
©2013 Baishideng Publishing Group Co.
World J Gastroenterol. Jul 14, 2013; 19(26): 4127-4136
Published online Jul 14, 2013. doi: 10.3748/wjg.v19.i26.4127
Published online Jul 14, 2013. doi: 10.3748/wjg.v19.i26.4127
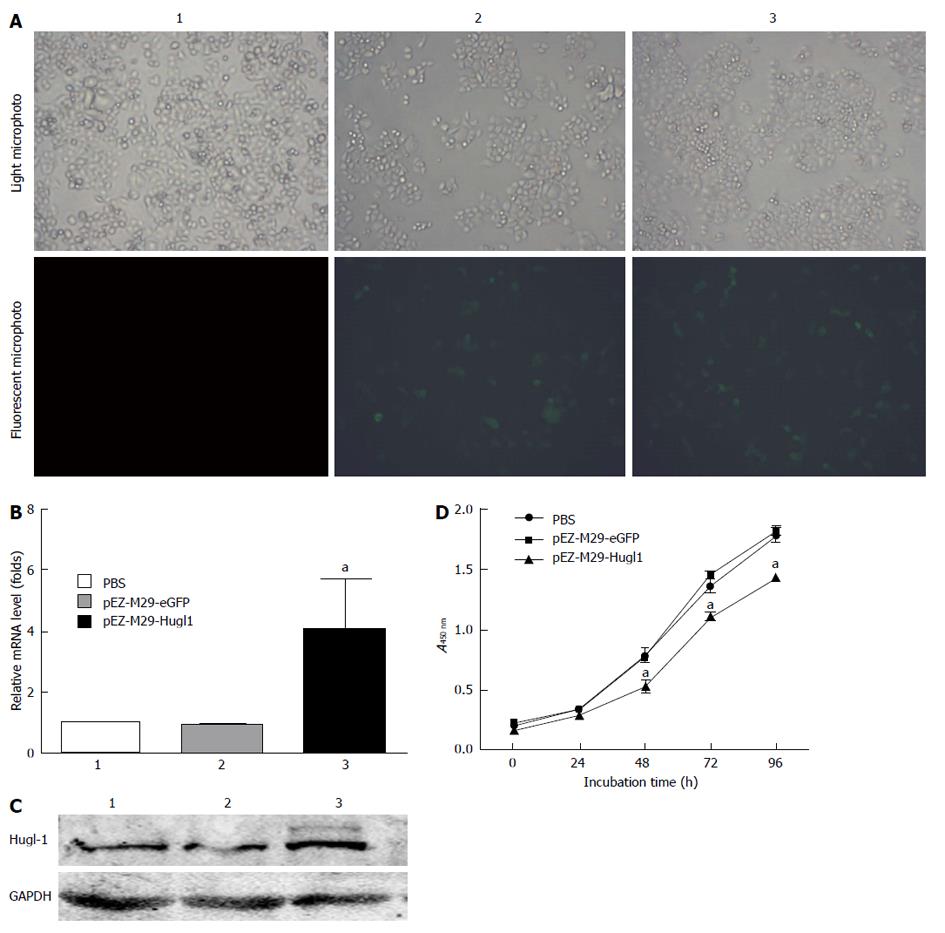
Figure 1 Transfection with pEZ-M29-Hugl1 increased Hugl-1 expression and inhibited the proliferation in Eca109 cells.
A: Fluorescent expression in Eca109 cells (× 200); B: Real-time reverse transcription-polymerase chain reaction data of Hugl-1 mRNA levels following transfection with pEZ-M29-Hugl1 plasmids (group 3), pEZ-M29-eGFP (group 2), or treatment with phosphate buffered saline (PBS) (group 1); C: Western blotting data showing Hugl-1 protein expression levels following pEZ-M29-Hugl1 transfection compared with control groups; D: The effect of Hugl-1 on cell proliferation was assessed by cell counting Kit-8. Results represent mean values of three experiments and are indicated as mean ± SD. aP < 0.05 vs the pEZ-M29-eGFP-treated and PBS-treated groups. GAPDH: Glyceraldehyde 3-phosphate dehydrogenase.
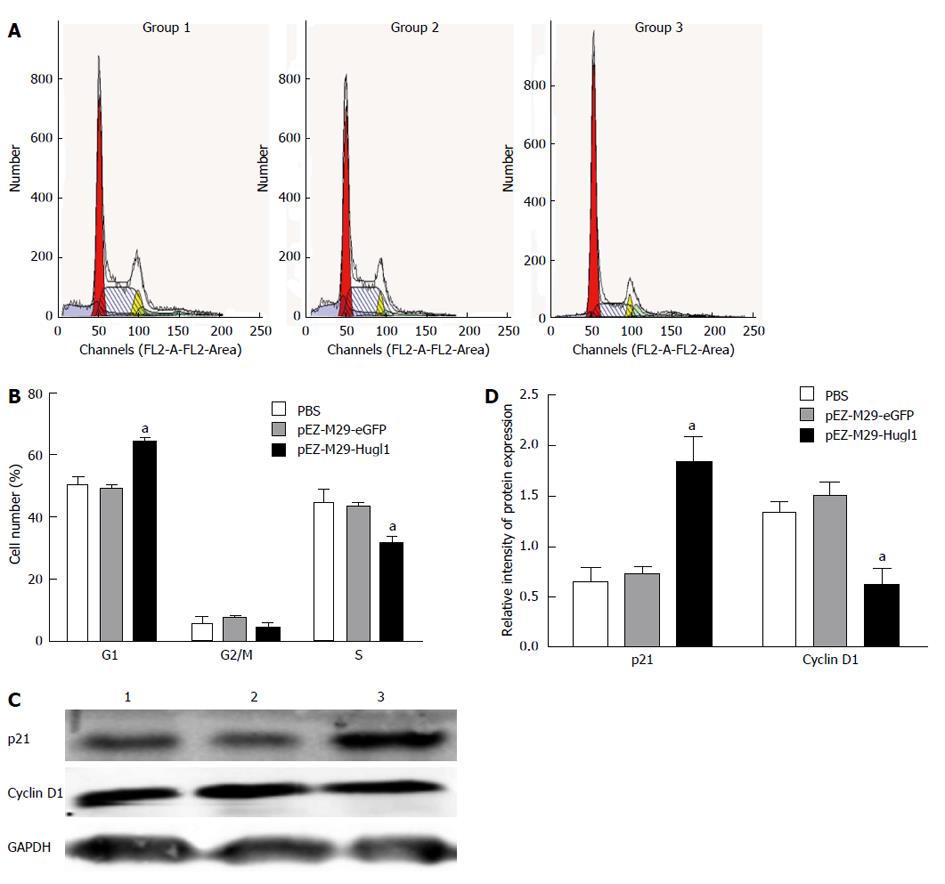
Figure 2 Effect of Hugl-1 on cell cycle distribution of Eca109 cells in vitro.
A: Cells were treated with pEZ-M29-Hugl1, pEZ-M29-eGFP or phosphate buffered saline (PBS) for 48 h and were then prepared for fluorescence-activated cell sorting analysis; B: Data are presented as mean ± SD of three independent experiments; C: Western blotting data of p21 and cyclin D1 protein expression levels following transfection with pEZ-M29-Hugl1 or controls; D: Analysis of the expression of proteins. aP < 0.05 vs the pEZ-M29-eGFP-treated and PBS-treated groups. GAPDH: Glyceraldehyde 3-phosphate dehydrogenase.
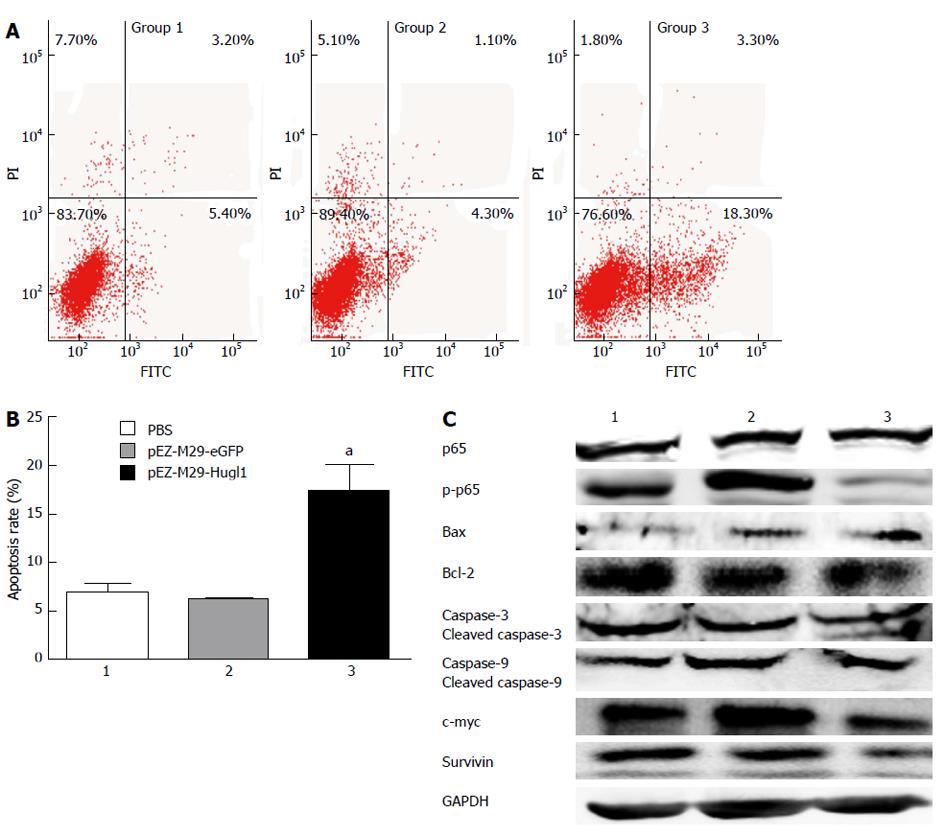
Figure 3 Effect of Hugl-1 on apoptosis of Eca109 cells in vitro.
A: Cells were treated for 48 h and were then processed for FACS by staining with Annexin V-fluorescein isothiocyanate (FITC) and propidium iodide (PI); B: After transfection with pEZ-M29-Hugl1, a significant number of cells were in an early state of apoptosis, and a population of cells had progressed to a later stage of apoptosis; C: Up-regulation of Hugl-1 led to a change of the protein levels of p65, p-p65, Bax, Bcl-2, caspase-3 and -9, survivin and c-myc among the three cell lines. All experiments were performed three times independently. aP < 0.05 vs the pEZ-M29-eGFP-treated and phosphate buffered solution (PBS)-treated groups. GAPDH: Glyceraldehyde 3-phosphate dehydrogenase.
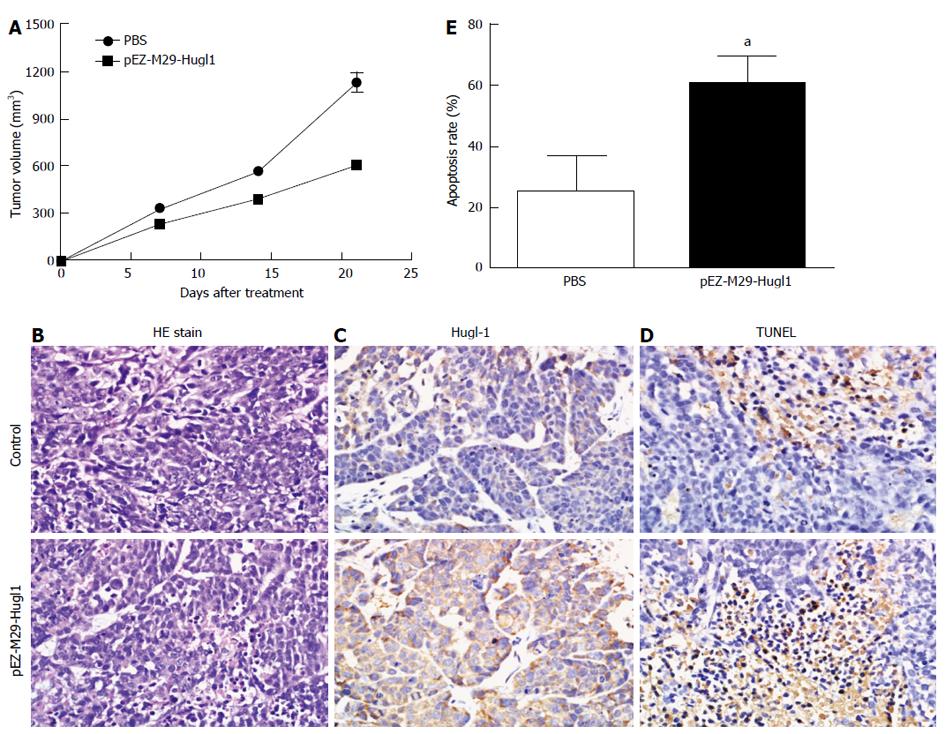
Figure 4 Effect of Hugl-1 on xenograft tumor in vivo.
A: Cells were injected subcutaneously into nude mice, and with one group of mice receiving pEZ-M29-Hugl1-treated cells and another receiving phosphate buffered saline (PBS). Tumor volume was measured at 7-d intervals for 21 d; B: Tumor sections were observed by hematoxylin and eosin (HE) staining (× 400); C: Expression of Hugl-1 in tumor tissues was analyzed by immunohistochemistry. Many cells were strongly positive for Hugl-1 in the pEZ-M29-Hugl1-treated tumor sections (× 400); D: Representative photomicrographs showing transferase-mediated dUTP nick end-labeling (TUNEL) staining for evidence of apoptosis in transplantation tumors undergoing various treatments (× 400); E: Quantitative analysis of apoptotic cells in tumors treated with PBS or pEZ-M29-Hugl1. Apoptotic cells, shown by TUNEL, were significantly increased in tumors treated with pEZ-M29-Hugl1. Data are presented as mean ± SD (× 400). aP < 0.05 vs the pEZ-M29-eGFP-treated and PBS-treated groups.
-
Citation: Song J, Peng XL, Ji MY, Ai MH, Zhang JX, Dong WG. Hugl-1 induces apoptosis in esophageal carcinoma cells both
in vitro andin vivo . World J Gastroenterol 2013; 19(26): 4127-4136 - URL: https://www.wjgnet.com/1007-9327/full/v19/i26/4127.htm
- DOI: https://dx.doi.org/10.3748/wjg.v19.i26.4127


