Copyright
©2013 Baishideng Publishing Group Co.
World J Gastroenterol. Jun 28, 2013; 19(24): 3781-3791
Published online Jun 28, 2013. doi: 10.3748/wjg.v19.i24.3781
Published online Jun 28, 2013. doi: 10.3748/wjg.v19.i24.3781
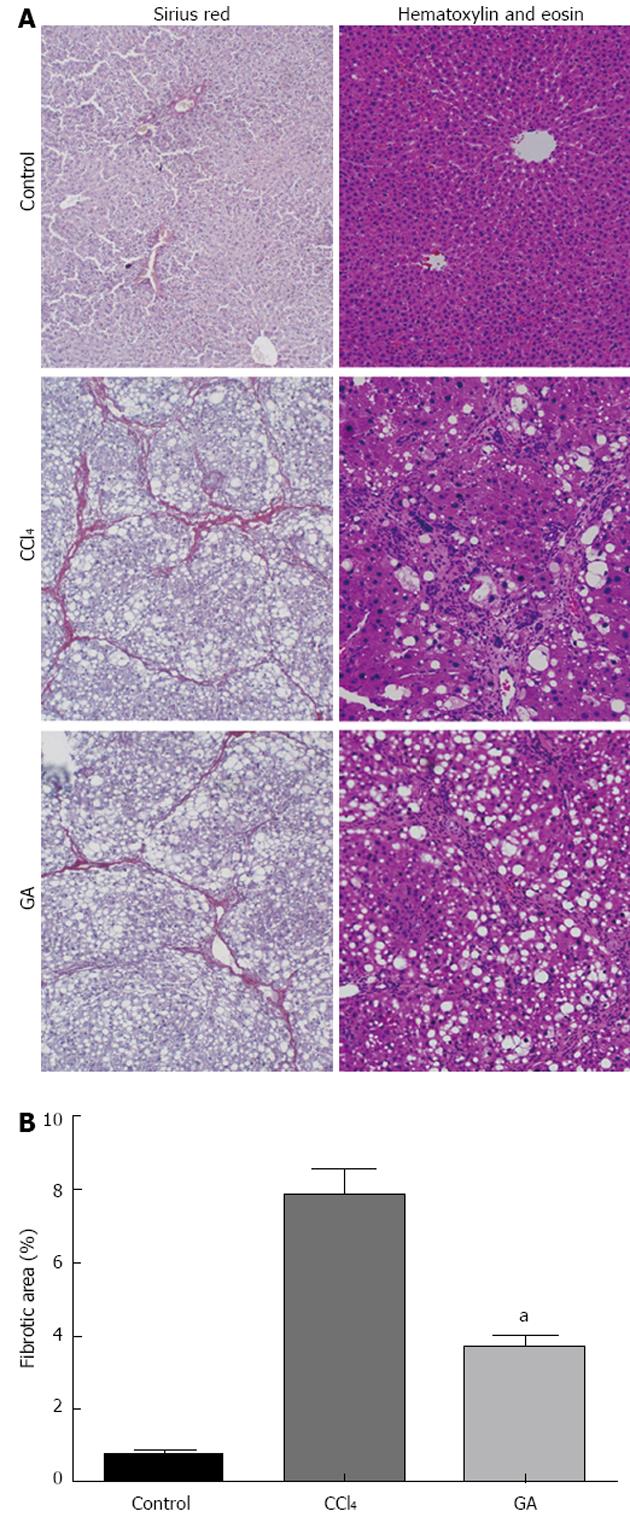
Figure 1 Histological examination of liver by hematoxylin and eosin and Sirius red staining.
A: Histological examination. Rats were treated with carbon tetrachloride (CCl4) and/or glycyrrhizic acid (GA). Liver tissue sections were stained with hematoxylin and eosin or Sirius red (original magnification, × 100); B: Quantitative analysis of liver fibrosis by Sirius red staining. Results are represented as fibrotic area (%), which signifies the proportion of area stained red/area of total area-vascular lumen. Values are mean ± SD. aP < 0.05 vs CCl4.
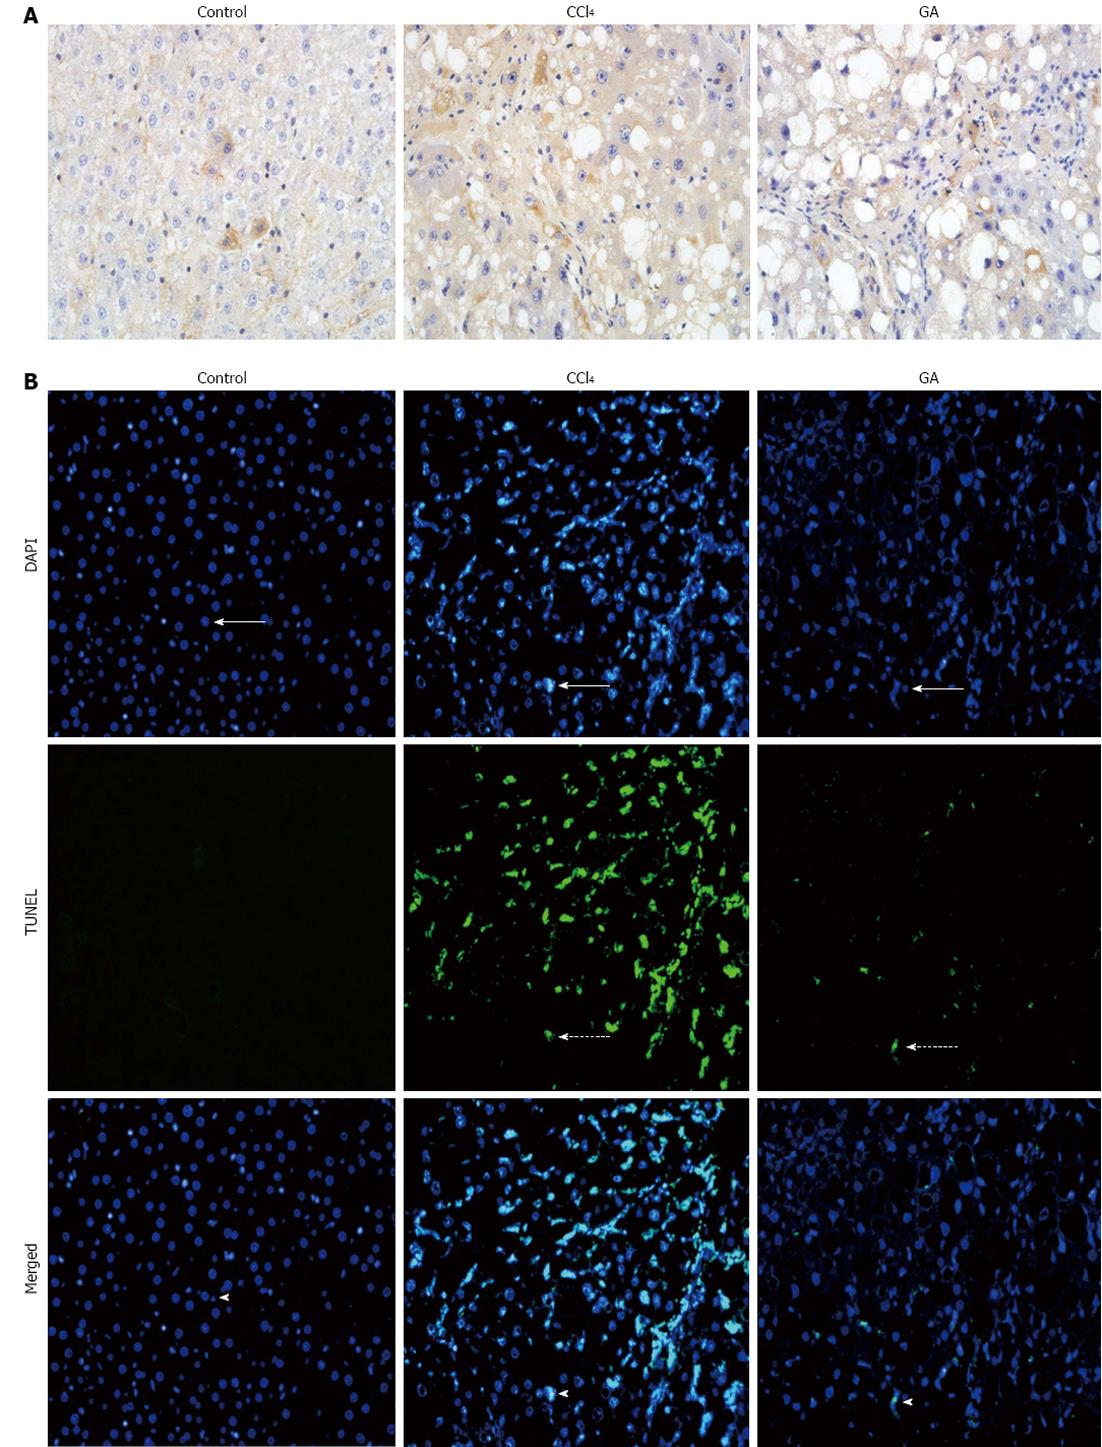
Figure 2 Impact of glycyrrhizic acid treatment on hepatic apoptosis induced by carbon tetrachloride in rats.
A: Liver tissue sections from the different groups were subjected to immunohistochemistry to determine the expression level of cleaved caspase-3 (original magnification, × 400); B: Fluorescence microscopy image showing terminal deoxynucleotidyl transferase-mediated deoxyuridine 5-triphosphate nick end labeling (TUNEL) stain (dashed arrows), and the same tissue slices were respectively counterstained with 4’6-diamidino-2-phenylindole (DAPI) to localize the nuclei (arrows). Images of combined with DAPI, indicated TUNEL-positive cells (arrow heads) (original magnification, × 200). GA: Glycyrrhizic acid; CCl4: Carbon tetrachloride.
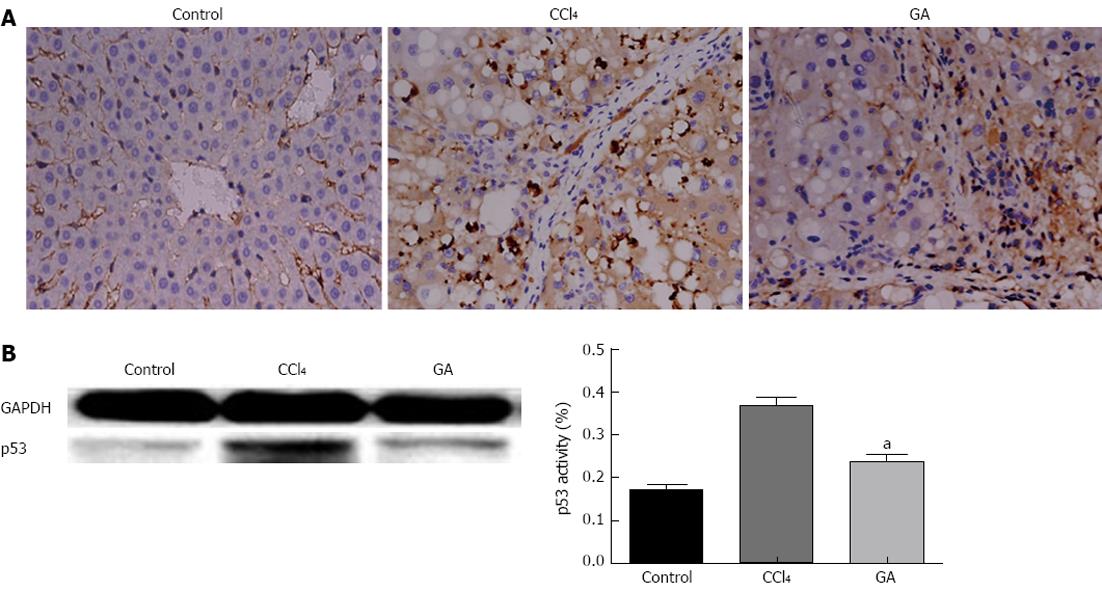
Figure 3 Effect of glycyrrhizic acid treatment on the expression level of p53 in the livers of rats injured by carbon tetrachloride.
A: Liver tissue slices from the different groups were subjected to immunohistochemistry (original magnification, × 400). B: Total protein fractions prepared from livers were analyzed by Western blotting to assess the expression level of p53 and GAPDH to confirm the same sample loading. The results of Western blotting analysis were similar in at least three replicate independent experiments. All values are presented as mean ± SD. Statistical significance was defined as follows: aP < 0.05 vs the carbon tetrachloride (CCl4) group. GA: Glycyrrhizic acid.
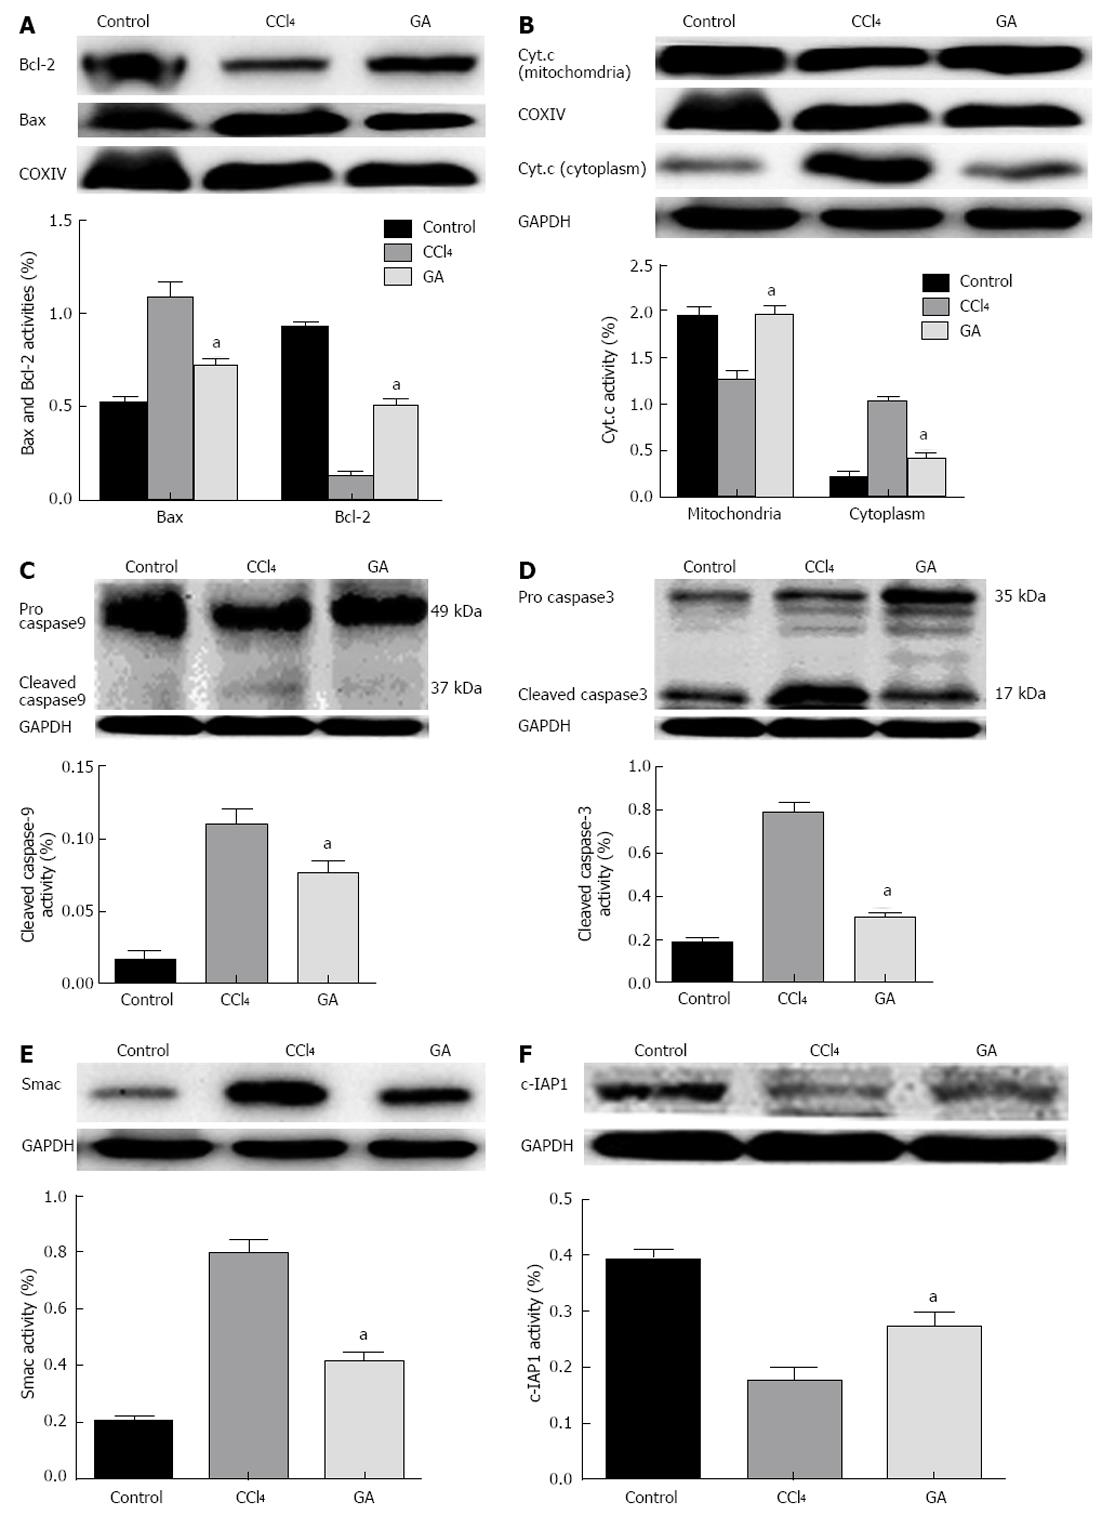
Figure 4 Impact of glycyrrhizic acid on CCl4-treated hepatocyte apoptosis signal cascades.
Protein extracts from livers in the different groups were subjected to Western blotting. A: Expression levels of Bax and Bcl-2 in the mitochondria; B: Expression levels of cytochrome C (Cyt.c) in the cytoplasm and mitochondria; C: Expression level of caspase-9 in the total protein; D: Expression level of caspase-3 in the total protein; E: Expression level of Smac in the cytoplasm; F: Expression level of c-IAP1 the total protein. In all these experiments glyceraldehyde-3-phosphate dehydrogenase (GAPDH), COXIV were used to ensure equal sample loading. The Western blotting results represent three independent tests. The bar graph represents the value of in the different proteins via the density of bands from at least three independent tests. All values are presented as mean ± SD. Statistical significant was defined as follows: aP < 0.05 vs the CCl4 group. GA: Glycyrrhizic acid; CCl4: Carbon tetrachloride.
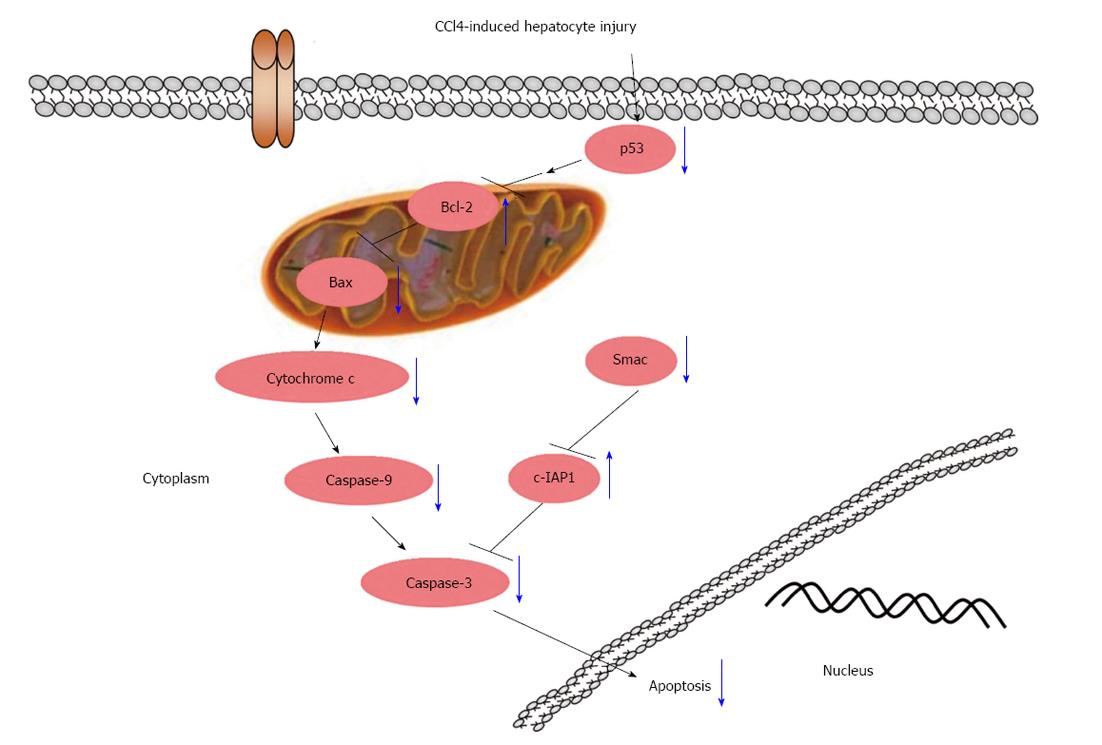
Figure 5 Schematic diagram of the effect of glycyrrhizic acid on the interruption of p53 signaling in carbon tetrachloride-induced hepatocyte apoptosis (blue arrows).
Glycyrrhizic acid (GA) suppressed the activation of p53, decreased the expression level of Bax and increased the expression level of Bcl-2, which resulted in reduced cytochrome C release from the mitochondria into the cytoplasm, and inactivated caspase-9 and -3; GA also significantly inhibited Smac release from mitochondria into the cytoplasm and elevated the expression level of c-IAP1, resulting in inhibition of caspase-3 activity. Ultimately, GA suppressed the apoptosis of hepatocytes.
-
Citation: Guo XL, Liang B, Wang XW, Fan FG, Jin J, Lan R, Yang JH, Wang XC, Jin L, Cao Q. Glycyrrhizic acid attenuates CCl4-induced hepatocyte apoptosis in rats
via a p53-mediated pathway. World J Gastroenterol 2013; 19(24): 3781-3791 - URL: https://www.wjgnet.com/1007-9327/full/v19/i24/3781.htm
- DOI: https://dx.doi.org/10.3748/wjg.v19.i24.3781


