Copyright
©2013 Baishideng Publishing Group Co.
World J Gastroenterol. May 28, 2013; 19(20): 3161-3164
Published online May 28, 2013. doi: 10.3748/wjg.v19.i20.3161
Published online May 28, 2013. doi: 10.3748/wjg.v19.i20.3161
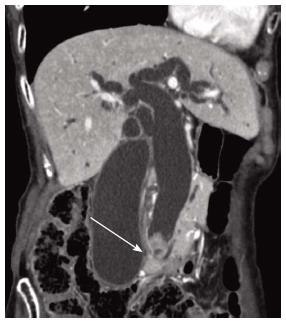
Figure 1 Computed tomography of the bile duct.
Computed tomography revealed dilatation of the bile duct and an elevated lesion (arrow) at the bottom of the lower bile duct.
Figure 2 Pathological findings from the resected bile duct (hematoxylin eosin staining).
A: A semi macro cross-sectional image of the resected extrahepatic bile duct. In the dilated bile duct, the tumor was comprised of two distinct parts: papillary (P) and solid (S); B: The boundary between the papillary (right) and solid (left) areas. The papillary area consisted of a papillary proliferation of cholangiocyte-like columnar epithelial cells covering fine fibrovascular cores (arrows). In the solid area, a lacunar tumor was evident, but lacked distinct acinar/glandular structures. Magnification: × 100; C: The solid tumor at higher magnification. Tumor cells exhibited characteristic salt-and-pepper nuclei, a high nucleus-to-cytoplasm ratio, and increased nuclear chromatin. Magnification: × 400.
Figure 3 Immunohistochemistry for cytokeratin 19, synaptophysin, and Ki-67.
A: Both the solid (asterisk) and papillary (arrows) components were positive for CK19. Magnification: × 200; B: Synaptophysin expression was evident in the solid component (left), indicating a neuroendocrine tumor, but not in the papillary component (right). Magnification: × 100; C: Although Ki-67-positive cells were scarce in the papillary component (arrows), many Ki-67-positive cells were identified in the solid component (asterisk). Magnification: × 200.
- Citation: Onishi I, Kitagawa H, Harada K, Maruzen S, Sakai S, Makino I, Hayashi H, Nakagawara H, Tajima H, Takamura H, Tani T, Kayahara M, Ikeda H, Ohta T, Nakanuma Y. Intraductal papillary neoplasm of the bile duct accompanying biliary mixed adenoneuroendocrine carcinoma. World J Gastroenterol 2013; 19(20): 3161-3164
- URL: https://www.wjgnet.com/1007-9327/full/v19/i20/3161.htm
- DOI: https://dx.doi.org/10.3748/wjg.v19.i20.3161


