Copyright
©2013 Baishideng Publishing Group Co.
World J Gastroenterol. May 28, 2013; 19(20): 3150-3156
Published online May 28, 2013. doi: 10.3748/wjg.v19.i20.3150
Published online May 28, 2013. doi: 10.3748/wjg.v19.i20.3150
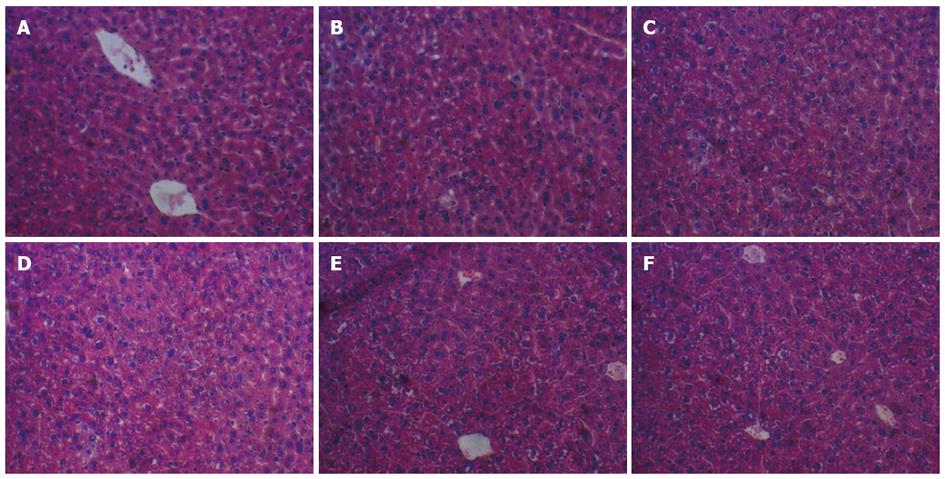
Figure 1 Effects of Lactobacillus plantarum SC4 or Lactobacillus plantarum CAI6 on liver morphology in mice fed high-cholesterol diet.
Tissues were stained with hematoxylin and eosin (20 × 10). A: High-cholesterol diet group; B: Normal diet group; C: Normal diet with Lactobacillus plantarum (L. plantarum) CAI6 group; D: Normal diet with L. plantarum SC4 group; E: High-cholesterol diet with L. plantarum CAI6 group; F: High-cholesterol diet with L. plantarum SC4 group.
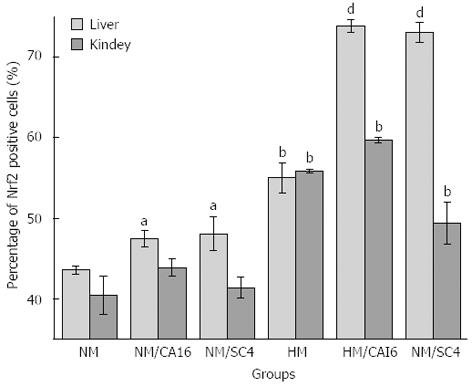
Figure 2 Effect of Lactobacillus plantarum SC4 or Lactobacillus plantarum CAI6 on liver and kidney nuclear factor-erythroid 2-related factor 2 expression in mice fed high-cholesterol diet.
Results were expressed as mean ± SD (n = 6). aP < 0.05 vs normal diet (NM) group, bP < 0.01 vs NM group, dP < 0.01 vs high-cholesterol diet (HM) group. NM/CAI6: Normal diet with Lactobacillus plantarum (L. plantarum) CAI6 group; NM/SC4: Normal diet with L. plantarum SC4 group; HM/CAI6: High-cholesterol diet with L. plantarum CAI6 group; HM/SC4: High-cholesterol diet with L. plantarum SC4 group; NM: Normal diet group; HM: High-cholesterol diet group.
-
Citation: Wang LX, Liu K, Gao DW, Hao JK. Protective effects of two
Lactobacillus plantarum strains in hyperlipidemic mice. World J Gastroenterol 2013; 19(20): 3150-3156 - URL: https://www.wjgnet.com/1007-9327/full/v19/i20/3150.htm
- DOI: https://dx.doi.org/10.3748/wjg.v19.i20.3150


