Copyright
©2013 Baishideng Publishing Group Co.
World J Gastroenterol. May 28, 2013; 19(20): 3007-3017
Published online May 28, 2013. doi: 10.3748/wjg.v19.i20.3007
Published online May 28, 2013. doi: 10.3748/wjg.v19.i20.3007
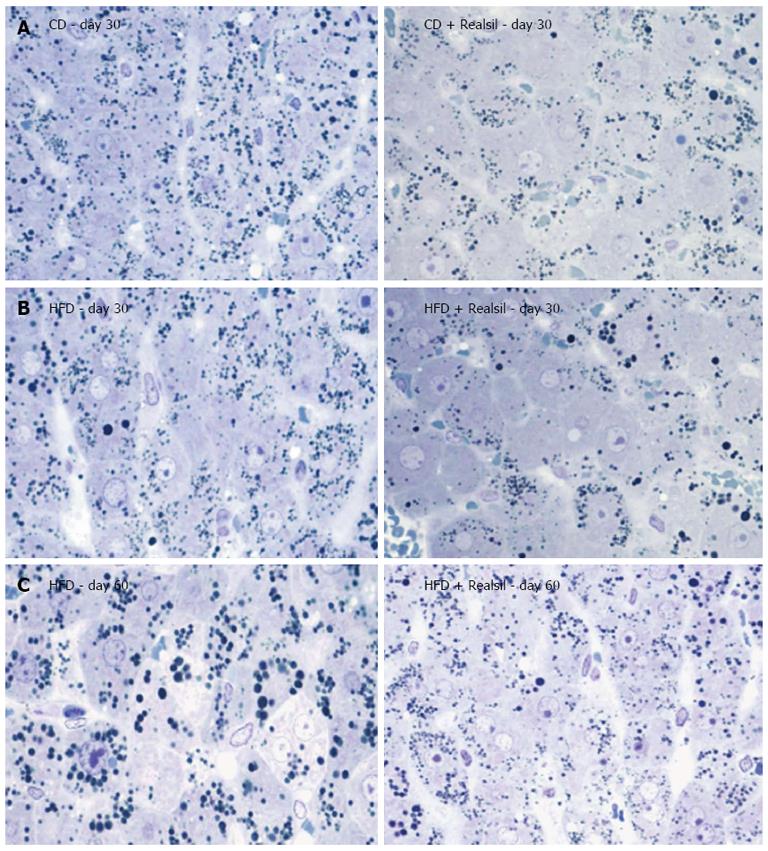
Figure 1 Light micrographs of rat liver stained with toluidin blue-periodic acid-schiff stain.
A: Liver from rat fed a choline deficient diet (day 30); B: Liver from rat fed a high fat diet (day 30); C: Liver from rat fed a high fat diet (day 60). Right column without and left column with administration of Realsil (Magnification: 200 ×). CD: Choline deficiency; HFD: High fat diet.
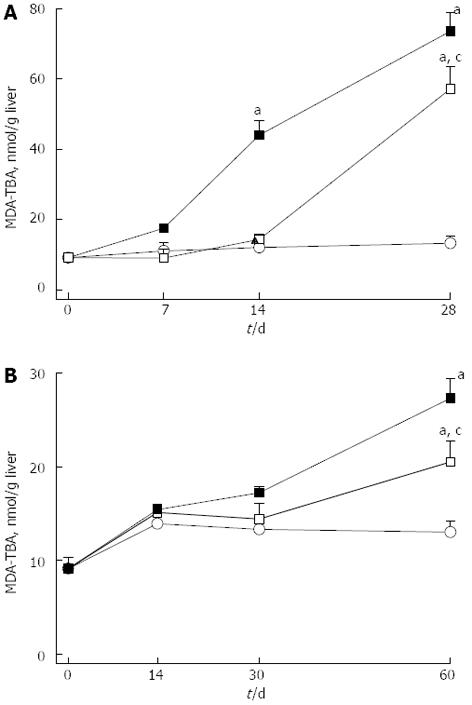
Figure 2 Concentrations of malondialdehyde-thiobarbituric acid reactive substances.
A: Liver of rat fed a choline-deficient diet; B: Liver of rat fed a high fat diet. Closed square: Without; open square: With Realsil administration; open circle: Control rats fed a standard chow-diet with adequate content of choline. Data are mean ± SD of n = 5 rats per group at each time point. aP < 0.05 vs control rats; cP < 0.05 vs untreated rats at the same time points. MDA-TBA: Malondialdehyde-thiobarbituric.
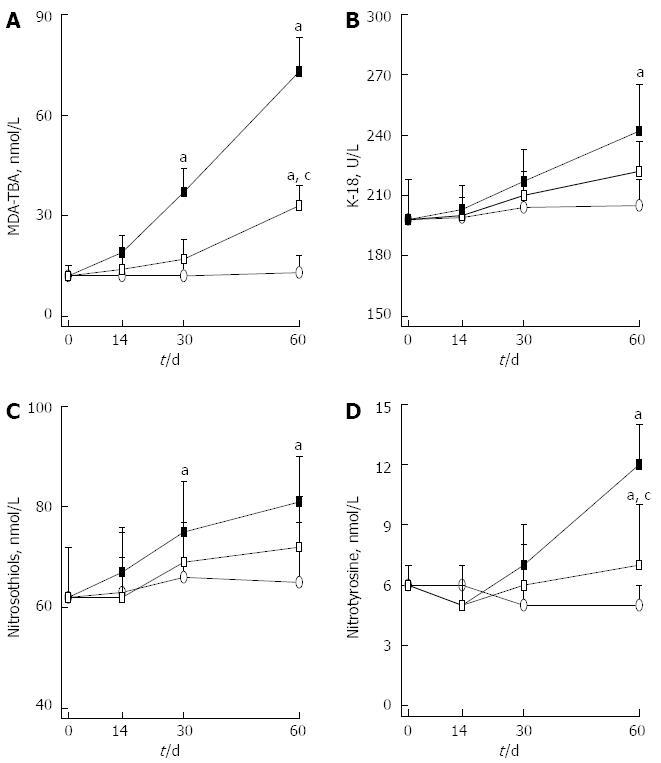
Figure 3 Plasma concentration of redox active and nitrogen regulating molecules.
A: Malondialdehyde-thiobarbituric acid reactive substances (MDA-TBA); B: Keratine 18 (K-18); C: Nitrosothiols; D: Nitrotyrosine. Rats were fed a high fat diet without (closed square) or with (open square) Realsil administration; control rats fed a standard chow-diet (open circle). Data are mean ± SD of n = 5 rats per group at each time point. aP < 0.05 vs control rats; cP < 0.05 vs untreated rats at the same time points.
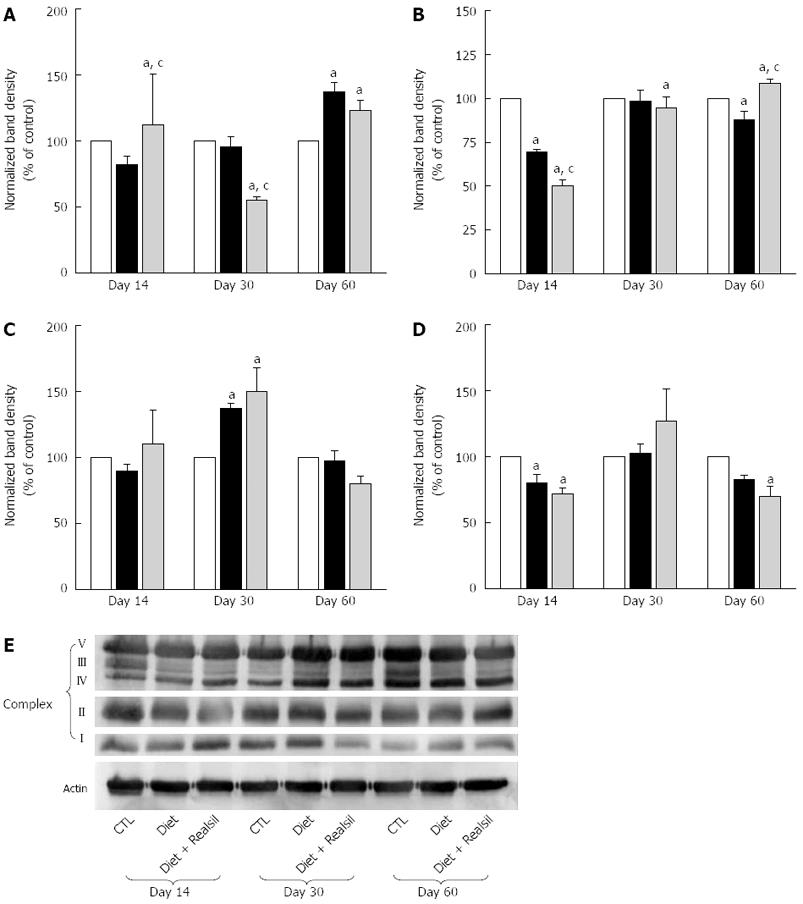
Figure 4 Western blotting analysis of the components of liver mitochondrial oxidative phosphorylation system in rats receiving high fat diet with (grey bar) or without (black bar) Realsil and in control (white bar) rats fed a standard chow-diet.
Band density for the target protein normalized for the corresponding β-actin for A: Respiratory complex I; B: Respiratory complex II; C: Respiratory complex IV; D: Respiratory complex V; E: Picture representative of Western blotting analysis. Data are means ± SE of n = 3-4 independent experiments. aP < 0.05 vs control rats; cP < 0.05 vs untreated rats at the same time points.
- Citation: Grattagliano I, Diogo CV, Mastrodonato M, de Bari O, Persichella M, Wang DQ, Liquori A, Ferri D, Carratù MR, Oliveira PJ, Portincasa P. A silybin-phospholipids complex counteracts rat fatty liver degeneration and mitochondrial oxidative changes. World J Gastroenterol 2013; 19(20): 3007-3017
- URL: https://www.wjgnet.com/1007-9327/full/v19/i20/3007.htm
- DOI: https://dx.doi.org/10.3748/wjg.v19.i20.3007


