Copyright
©2013 Baishideng Publishing Group Co.
World J Gastroenterol. May 7, 2013; 19(17): 2650-2659
Published online May 7, 2013. doi: 10.3748/wjg.v19.i17.2650
Published online May 7, 2013. doi: 10.3748/wjg.v19.i17.2650
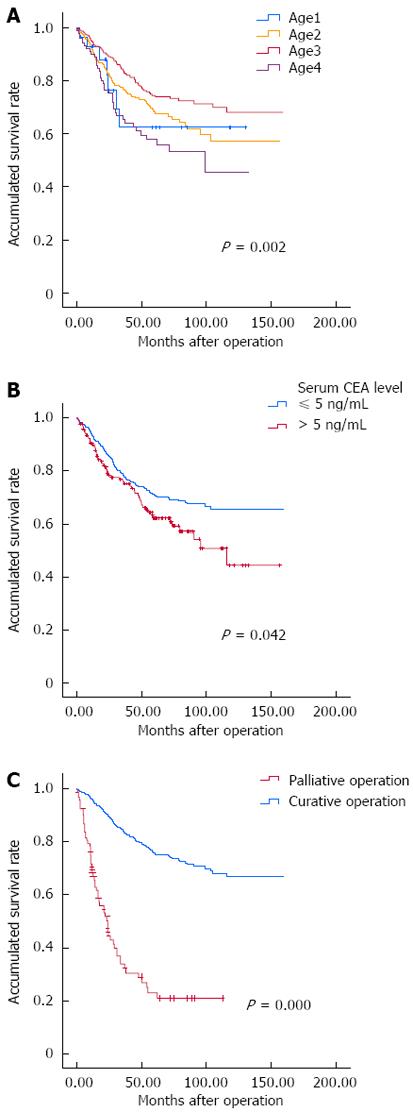
Figure 1 Survival curves of colorectal cancer patients.
A: In different age groups; B: With different carcino-embryonic antigen levels; C: With different operation status. CEA: Carcinoembryonic antigen.
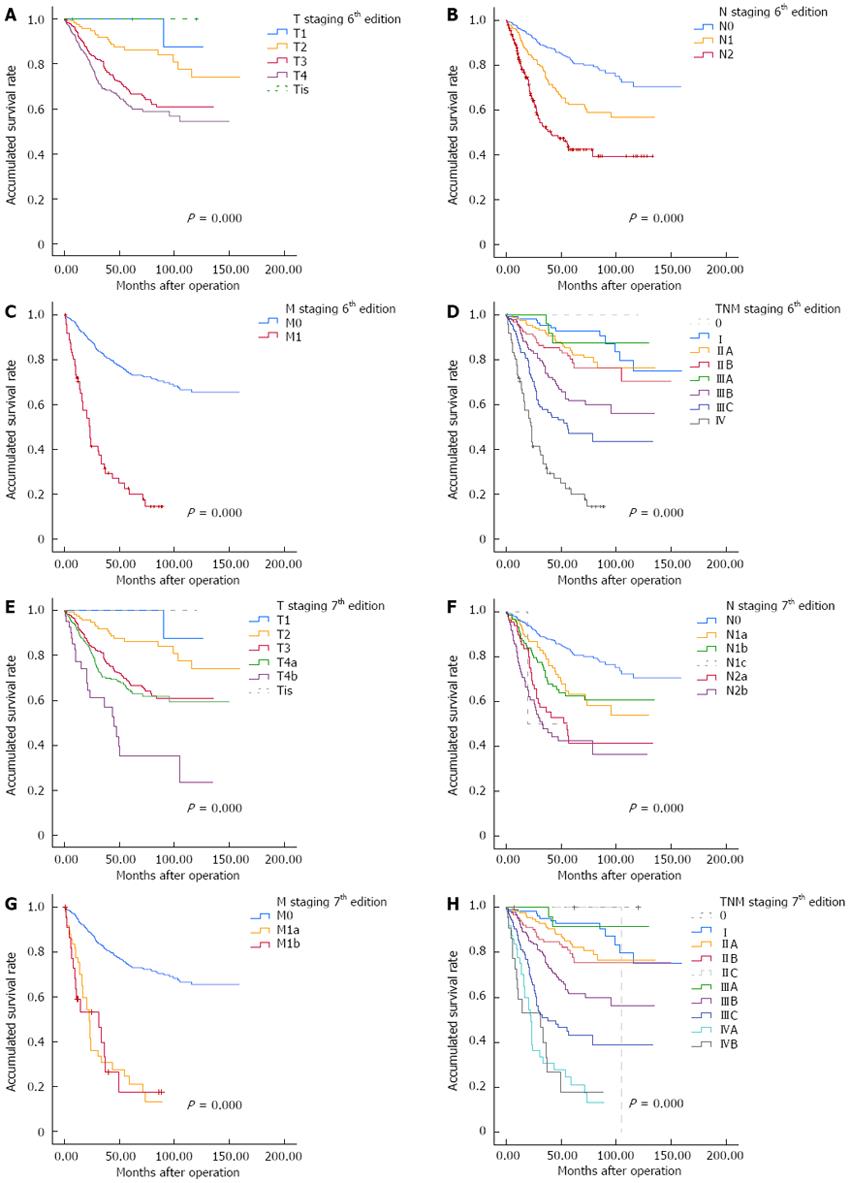
Figure 2 Survival curves of colorectal cancer patients.
A-D: According to the 6th edition of the tumor node metastasis classification; E-H: According to the 7th edition of the tumor node metastasis classification.
Figure 3 Survival curves of colorectal cancer patients in different lymph node ratio groups.
LNR: Lymph node ratio.
- Citation: Yuan Y, Li MD, Hu HG, Dong CX, Chen JQ, Li XF, Li JJ, Shen H. Prognostic and survival analysis of 837 Chinese colorectal cancer patients. World J Gastroenterol 2013; 19(17): 2650-2659
- URL: https://www.wjgnet.com/1007-9327/full/v19/i17/2650.htm
- DOI: https://dx.doi.org/10.3748/wjg.v19.i17.2650


