Copyright
©2013 Baishideng Publishing Group Co.
World J Gastroenterol. Mar 21, 2013; 19(11): 1834-1840
Published online Mar 21, 2013. doi: 10.3748/wjg.v19.i11.1834
Published online Mar 21, 2013. doi: 10.3748/wjg.v19.i11.1834
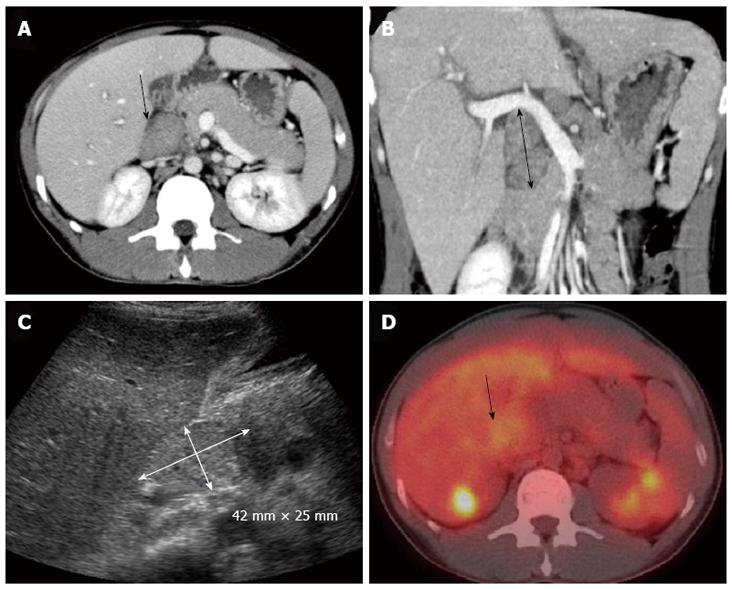
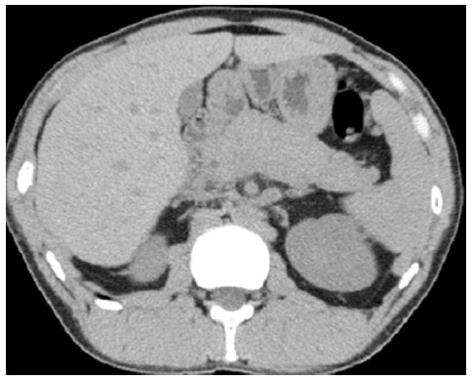
Figure 1 Imaging findings.
A: Dynamic computed tomographic image (CT) of a transverse section; B: A coronal section revealing enlargement of the hepatoduodenal ligament lymph nodes (arrows); C: Ultrasonography of the abdomen revealing a large mass in the region of the hepatic portal vein (arrow); D: Positron emission tomography/CT using 18F-fluorodeoxyglucose revealing mild accumulation. The maximum standardized uptake value was 3.98. The arrow shows the hepatoduodenal ligament lymph nodes.
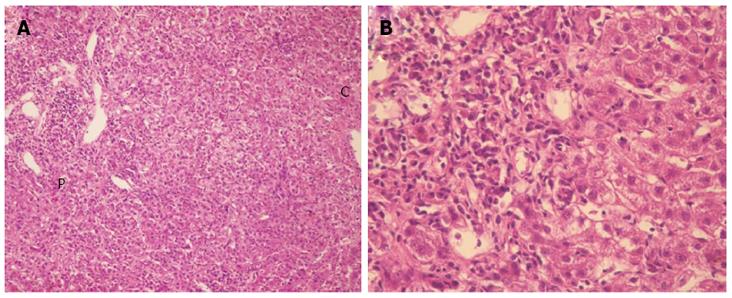
Figure 2 Liver biopsy.
A: Liver biopsy specimen with hematoxylin and eosin staining (× 100 magnification) revealing the histopathological appearance of acute hepatitis. Interface hepatitis and plasmacytic infiltrates are present; B: This is the same image at × 400 magnification. P: Portal area; C: Central vein area.
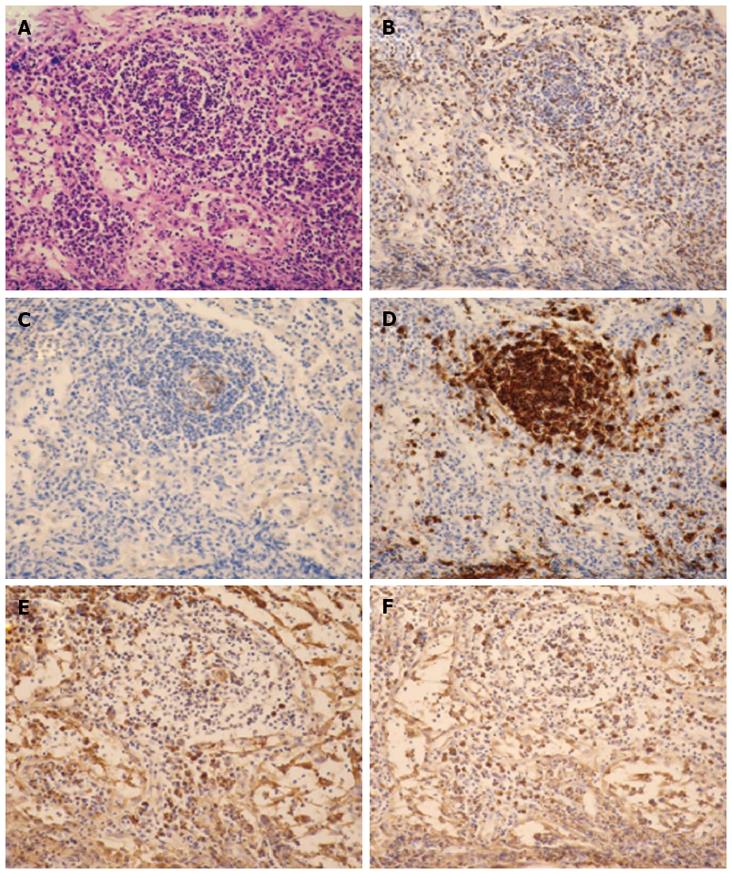
Figure 3 Histological sections of hepatoduodenal ligament lymph nodes (× 200 magnification).
A: The lymphoid follicles contain a reactive germinal center with hematoxylin and eosin staining. No evidences of granuloma or necrosis are visible; B: CD3 (T-cell marker) is positive in the interfollicular areas; C: CD10 (a marker of B-cell activation) is positive in the center of the follicles; D: CD20 (B-cell marker) is observed in the nodules; E: Kappa chain; F: Lambda chain. Neither the kappa nor the lambda chains predominate.
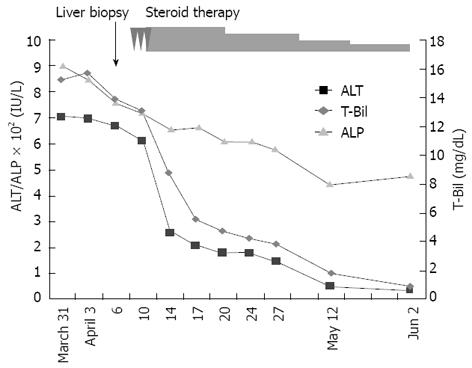
Figure 4 Clinical course.
The patients showed high levels of alanine aminotransferase, alkaline phosphatase and total bilirubin. However, after the initial corticosteroid therapy, these levels improved gradually. ALT: Alanine aminotransferase; ALP: Alkaline phosphatase; T-Bil: Total bilirubin.
Figure 5 Computed tomography of the transverse section recorded 2 mo after starting corticosteroid.
The hepatoduodenal ligament lymph nodes reduced in size.
- Citation: Fujii H, Ohnishi N, Shimura K, Sakamoto M, Ohkawara T, Sawa Y, Nishida K, Ohkawara Y, Kobata T, Yamaguchi K, Itoh Y. Case of autoimmune hepatitis with markedly enlarged hepatoduodenal ligament lymph nodes. World J Gastroenterol 2013; 19(11): 1834-1840
- URL: https://www.wjgnet.com/1007-9327/full/v19/i11/1834.htm
- DOI: https://dx.doi.org/10.3748/wjg.v19.i11.1834


