Copyright
©2013 Baishideng Publishing Group Co.
World J Gastroenterol. Mar 21, 2013; 19(11): 1834-1840
Published online Mar 21, 2013. doi: 10.3748/wjg.v19.i11.1834
Published online Mar 21, 2013. doi: 10.3748/wjg.v19.i11.1834
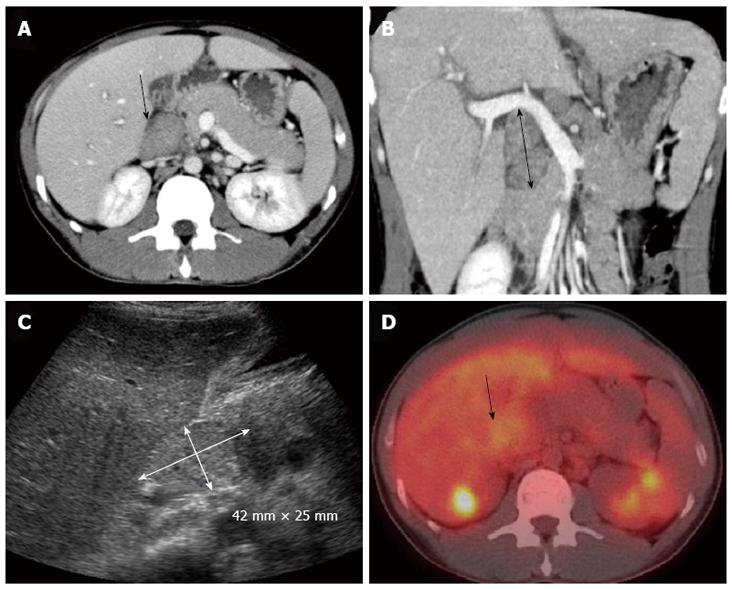
Figure 1 Imaging findings.
A: Dynamic computed tomographic image (CT) of a transverse section; B: A coronal section revealing enlargement of the hepatoduodenal ligament lymph nodes (arrows); C: Ultrasonography of the abdomen revealing a large mass in the region of the hepatic portal vein (arrow); D: Positron emission tomography/CT using 18F-fluorodeoxyglucose revealing mild accumulation. The maximum standardized uptake value was 3.98. The arrow shows the hepatoduodenal ligament lymph nodes.
- Citation: Fujii H, Ohnishi N, Shimura K, Sakamoto M, Ohkawara T, Sawa Y, Nishida K, Ohkawara Y, Kobata T, Yamaguchi K, Itoh Y. Case of autoimmune hepatitis with markedly enlarged hepatoduodenal ligament lymph nodes. World J Gastroenterol 2013; 19(11): 1834-1840
- URL: https://www.wjgnet.com/1007-9327/full/v19/i11/1834.htm
- DOI: https://dx.doi.org/10.3748/wjg.v19.i11.1834


