Copyright
©2012 Baishideng Publishing Group Co.
World J Gastroenterol. Feb 28, 2012; 18(8): 855-860
Published online Feb 28, 2012. doi: 10.3748/wjg.v18.i8.855
Published online Feb 28, 2012. doi: 10.3748/wjg.v18.i8.855
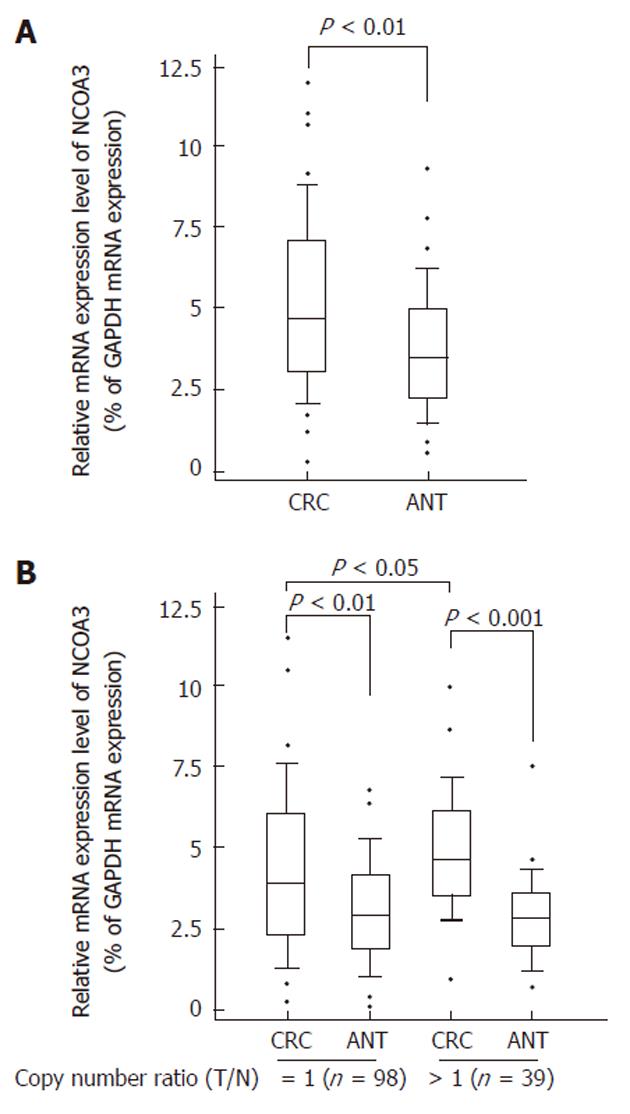
Figure 1 Real-time polymerase chain reaction assay was carried out as described under Materials and Methods section, and the results were obtained from indicated groups of samples.
Boxplots of relative copy number of NCOA3 mRNA measured with real-time polymerase chain reaction analysis showing the median; box: 25th-75th percentile; bars: largest and smallest values within 1.5 box lengths; little circles: outliers. A: mRNA expression level of NCOA3 in all the colorectal cancers (CRC) samples compared with adjacent normal tissues; B: mRNA expression level of NCOA3 in groups with amplified or unaltered DNA copies. ANT: Adjacent normal tissue; GAPDH: Glyceraldehyde-3-phosphate dehydrogenase..
-
Citation: Li Z, Fang ZY, Ding Y, Yao WT, Yang Y, Zhu ZQ, Wang W, Zhang QX. Amplifications of
NCOA3 gene in colorectal cancers in a Chinese population. World J Gastroenterol 2012; 18(8): 855-860 - URL: https://www.wjgnet.com/1007-9327/full/v18/i8/855.htm
- DOI: https://dx.doi.org/10.3748/wjg.v18.i8.855


