Copyright
©2012 Baishideng Publishing Group Co.
World J Gastroenterol. Dec 21, 2012; 18(47): 7087-7092
Published online Dec 21, 2012. doi: 10.3748/wjg.v18.i47.7087
Published online Dec 21, 2012. doi: 10.3748/wjg.v18.i47.7087
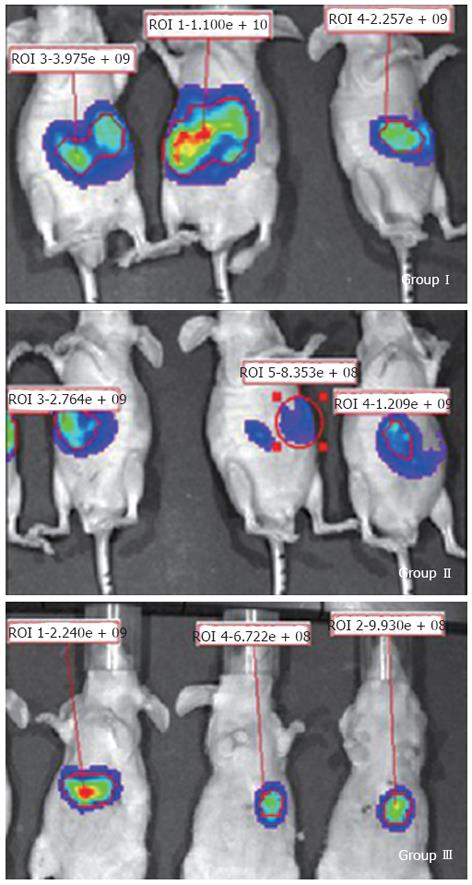
Figure 1 Representative images of fluorescence signals in nude mice detected by the International Veterinary Information Service system.
The fluorescence signal intensity shows xenograft tumor size.
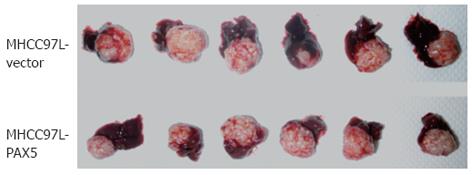
Figure 2 Harvesting orthotopic liver transplantation tumors.
Tumors were harvested from the mice in groups II and III. Tumor size and weight in the paired box gene 5 (PAX5) group were smaller than those in the control group (P < 0.0001).
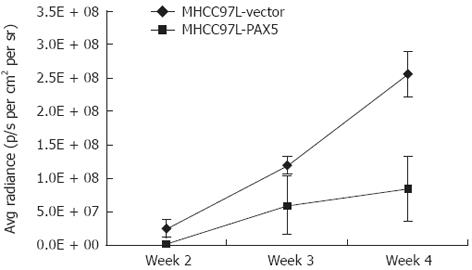
Figure 3 Tumor growth curve determined by the International Veterinary Information Service system.
The P value was calculated using repeated measures analysis of variance. PAX5: Paired box gene 5.
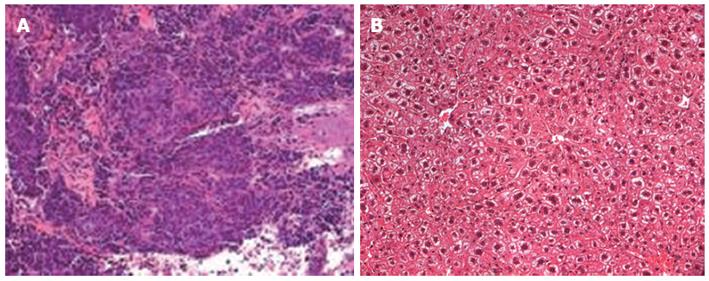
Figure 4 Liver tissues from nude mice were detected by hematoxylin and eosin staining.
A: Liver tumor, × 200; B: Normal liver, × 200.
Figure 5 Gene expression of paired box gene 5 in liver tumor tissues of mice in situ which was detected by reverse transcription-polymerase chain reaction.
The expression of β-actin which acted as the internal control was determined. PAX5: Paired box gene 5.
- Citation: Zhao GJ, Xu LX, Chu ES, Zhang N, Shen JY, Damirin A, Li XX. Establishment of an orthotopic transplantation tumor model of hepatocellular carcinoma in mice. World J Gastroenterol 2012; 18(47): 7087-7092
- URL: https://www.wjgnet.com/1007-9327/full/v18/i47/7087.htm
- DOI: https://dx.doi.org/10.3748/wjg.v18.i47.7087


