Copyright
©2012 Baishideng Publishing Group Co.
World J Gastroenterol. Oct 14, 2012; 18(38): 5351-5359
Published online Oct 14, 2012. doi: 10.3748/wjg.v18.i38.5351
Published online Oct 14, 2012. doi: 10.3748/wjg.v18.i38.5351
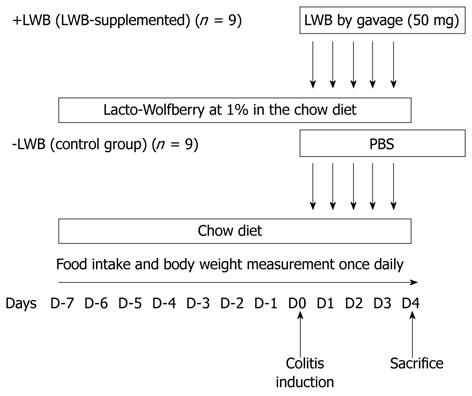
Figure 1 Animal study design.
Body weight and food intake was monitored throughout the duration of the experiment (i.e., D-7 to D4). Colitis was induced on D0. For the Lacto-wolfberry (LWB) fed group, diet was supplemented with 1% LWB from D-7 until D4 and 50 mg of LWB was also gavaged from D0 to D4. Control animals were fed regular diet for the same period and gavaged with equal volume of control solution from D0 to D4. PBS: Phosphate buffered solution.
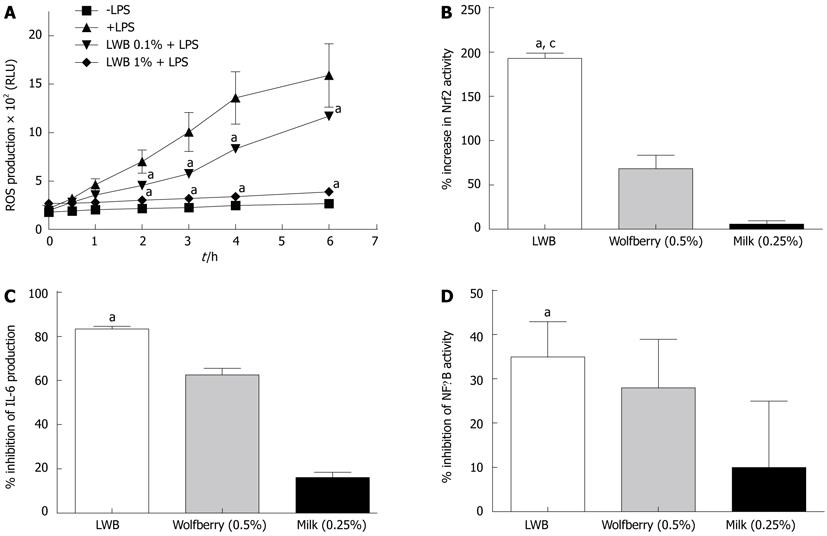
Figure 2 Anti-inflammatory and anti-oxidative effects of Lacto-Wolfberry in vitro.
A: The effect of Lacto-Wolfberry (LWB) on lipopolysaccharide (LPS)-induced reactive oxygen species (ROS) production in RAW 264.7 cells was measured as described in the methods section. Results are expressed in relative luminescence units (RLU). aP < 0.05 at the given time points and dose as compared to LPS-stimulated ROS production (+LPS); B: Effects of given concentrations of LWB, milk and wolfberry on NF-E2 related 2 activity in AREc32 cells. Results are expressed as percentage of increase compared to control conditions. aP < 0.05 vs milk; cP < 0.05 vs wolfberry; C: Effects of given concentrations of LWB, milk and wolfberry on LPS-induced interleukin-6 production in RAW 264.7 cells. Results are expressed as percentage of inhibition compared to induction after LPS stimulation. aP < 0.05 vs milk; D: Effects of given concentrations of LWB, milk and wolfberry on tumor necrosis factor-α-induced nuclear factor- κB activation in a reporter cell line. Results are expressed as percentage of inhibition compared to induction after TNF-α stimulation. All results are depicted as mean ± SE. aP < 0.05 vs milk.
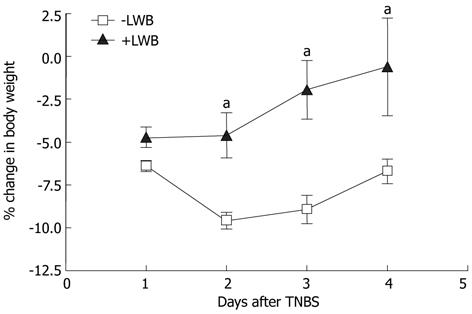
Figure 3 Lacto-Wolfberry attenuates colitis-induced body weight loss.
Percentage change in body weight was calculated from a ratio of body weight measured at each day after colitis induction and body weight at D0. Results are depicted as mean ± SE. aP < 0.05 vs -Lacto-Wolfberry (LWB) at the respective time points. TNBS: 2,4,6-trinitrobenzene sulfonic acid.
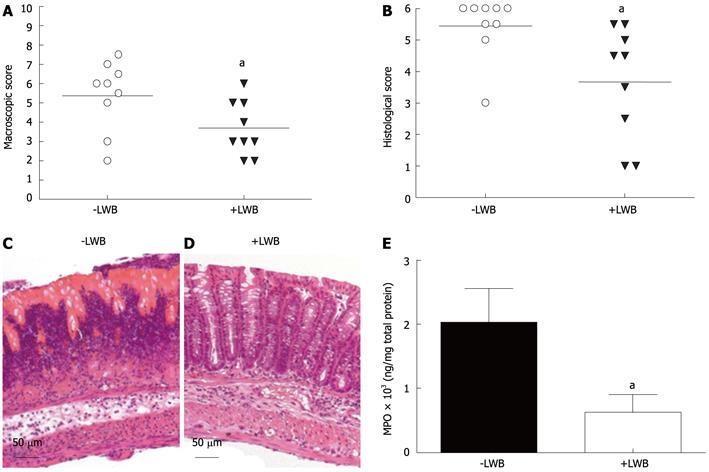
Figure 4 Lacto-Wolfberry reduces colonic inflammation.
A: Macroscopic evaluation of the colon was performed according to Wallace criteria. Results are expressed in individual values and the mean value is represented by the horizontal black line; B: Histological evaluation and scoring of the colon was performed according to the Ameho criteria. The individual scores of the mice in the two groups are provided, with the mean value being represented by the horizontal line; C: Representative section of score 6 from the control fed mice [-Lacto-Wolfberry (LWB)]; D: Representative section of score 1 from LWB fed mice (+LWB); E: Colonic myeloperoxidase (MPO) levels were measured by enzyme linked immunosorbant assay. The values are represented as mean ± SE. aP < 0.05 vs -LWB.
Figure 5 Effect of Lacto-Wolfberry on cyclooxygenase-2 and phosphorylated- signal transducer and activator of transcription-3 levels.
A: Cyclooxygenase-2 (COX-2) levels were assessed semi-quantitatively by Western blotting and densitometry. COX-2 levels were normalized to β-actin. Results are expressed in mean ± SE. aP < 0.05 vs -Lacto-Wolfberry (LWB); B: Phosphorylated-signal transducer and activator of transcription-3 (pSTAT3) levels were assessed by Western blotting and densitometry. The results are expressed as a ratio of pSTAT3 to STAT3 (mean ± SE). P = 0.057 vs -LWB group.
Figure 6 Anti-oxidant effect of Lacto-Wolfberry in murine colitis.
A: mRNA expression of glutathione peroxidase 1 (GPx1) was measured as described in methods section. Results are expressed as mean ± SE; B: Anti-oxidant ability in plasma was measured in mmol/L Trolox equivalent. Results are expressed in mean ± SE. aP < 0.05 vs -Lacto-Wolfberry (LWB).
- Citation: Philippe D, Brahmbhatt V, Foata F, Saudan Y, Serrant P, Blum S, Benyacoub J, Vidal K. Anti-inflammatory effects of Lacto-Wolfberry in a mouse model of experimental colitis. World J Gastroenterol 2012; 18(38): 5351-5359
- URL: https://www.wjgnet.com/1007-9327/full/v18/i38/5351.htm
- DOI: https://dx.doi.org/10.3748/wjg.v18.i38.5351


