Copyright
©2012 Baishideng Publishing Group Co.
World J Gastroenterol. Aug 7, 2012; 18(29): 3889-3895
Published online Aug 7, 2012. doi: 10.3748/wjg.v18.i29.3889
Published online Aug 7, 2012. doi: 10.3748/wjg.v18.i29.3889
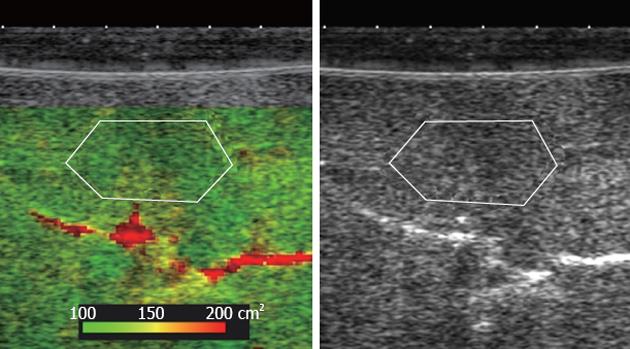
Figure 1 Acoustic structure quantification imaging.
In parametric imaging, the intensity distribution can be visualized and displayed on a split screen by color coding. The large-region of interest was set at a fixed depth of 2.5 mm from the liver surface.
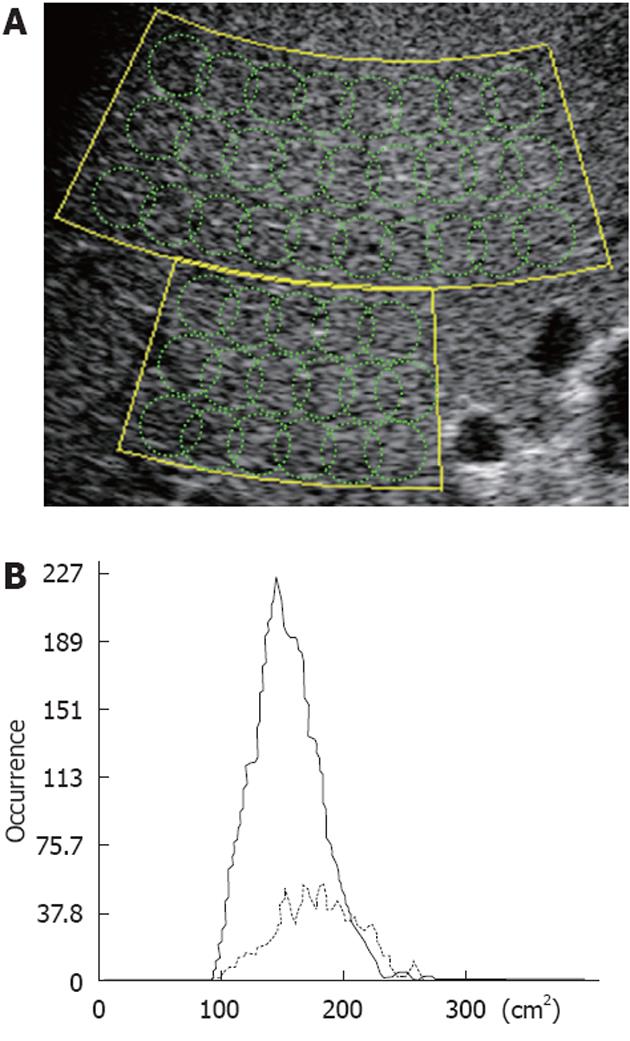
Figure 2 Schematic of region of interests used for statistical analysis of the radio frequency signal with the acoustic structure quantification method, and the Cm2-histogram.
A: The set large-region of interest (ROI) actually consists of several hundred small ROIs used to calculate multiple Cm2 (intensity or amplitude) values; B: Results are shown as the occurrence in the Cm2 histogram.
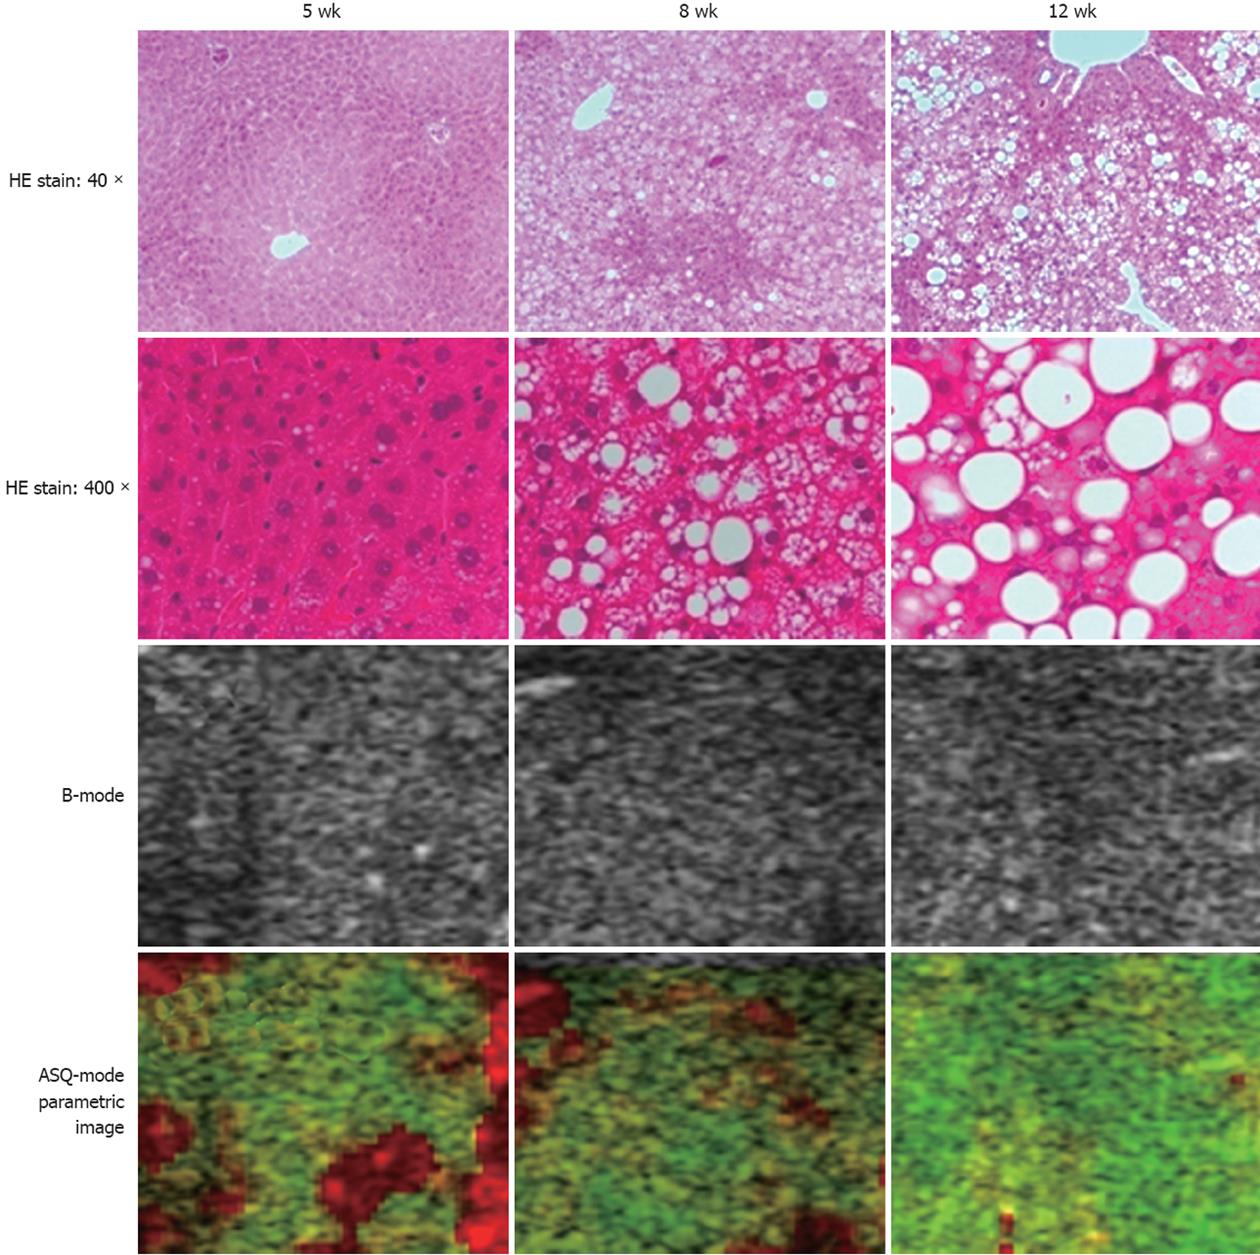
Figure 3 Representative histological findings, B-mode images and acoustic structure quantification-mode images for each group.
No fibrosis or inflammation was observed in any groups. Large fat droplets were mainly observed at 12 wk old. In parametric imaging, red and green existed together at 5 wk, and red decreased and green was more abundant at 12 wk. ASQ: Acoustical structure quantification.
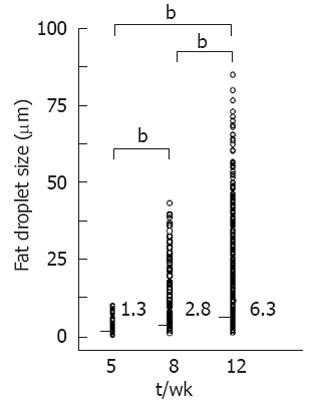
Figure 4 Comparison of fat droplet size.
Median fat droplet size increased significantly (bP < 0.01) with age, from 1.33 μm (range: 0.55-10.52 μm) at 5 wk, to 2.82 μm (range: 0.61-44.13 μm) at 8 wk and 6.34 μm (range: 0.66-81.83 μm) at 12 wk.
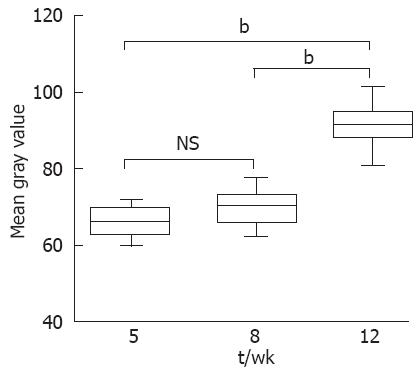
Figure 5 Comparison of liver echogenicity.
Mean gray values in each group were 65.31 ± 22.52 at 5 wk, 65.95 ± 19.41 at 8 wk, and 91.32 ± 21.83 at 12 wk. Although no difference was apparent between the 5 and 8 wk old groups, mean gray value was significantly elevated in the 12 wk old group, with increased brightness of the hepatic parenchyma. bP < 0.01. NS: Not significant.
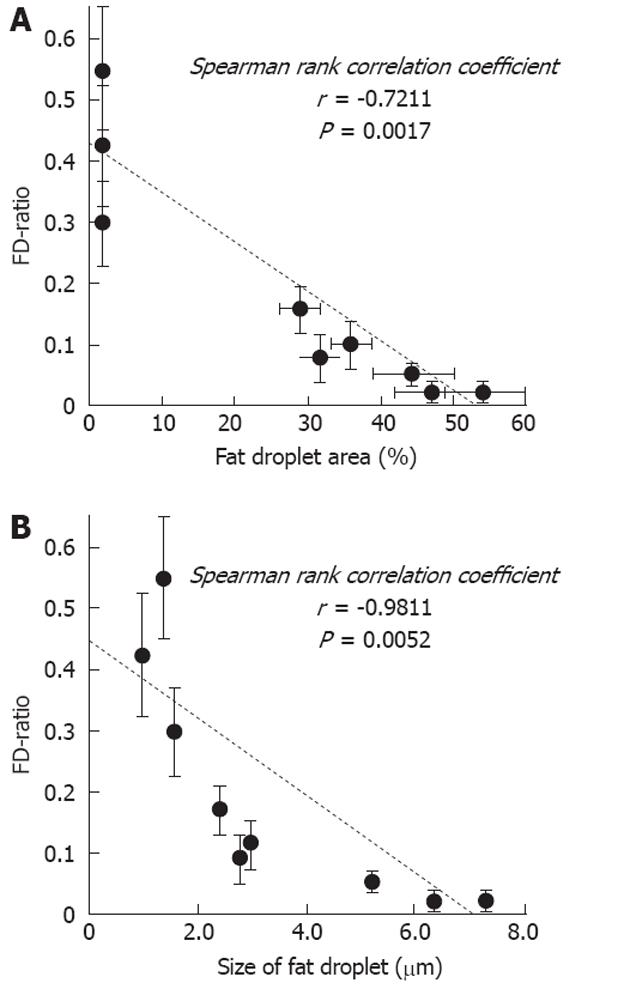
Figure 6 Relationship between “focal disturbance ratio” and fat droplet area or size of fat droplets.
A: Significant negative correlations were observed between focal disturbance ratio (FD-ratio) and either fat droplet area (r = -0.7211, P = 0.0017); B: Fat droplet size (r = -0.9811, P = 0.0052).
- Citation: Kuroda H, Kakisaka K, Kamiyama N, Oikawa T, Onodera M, Sawara K, Oikawa K, Endo R, Takikawa Y, Suzuki K. Non-invasive determination of hepatic steatosis by acoustic structure quantification from ultrasound echo amplitude. World J Gastroenterol 2012; 18(29): 3889-3895
- URL: https://www.wjgnet.com/1007-9327/full/v18/i29/3889.htm
- DOI: https://dx.doi.org/10.3748/wjg.v18.i29.3889


