Copyright
©2012 Baishideng Publishing Group Co.
World J Gastroenterol. Aug 7, 2012; 18(29): 3889-3895
Published online Aug 7, 2012. doi: 10.3748/wjg.v18.i29.3889
Published online Aug 7, 2012. doi: 10.3748/wjg.v18.i29.3889
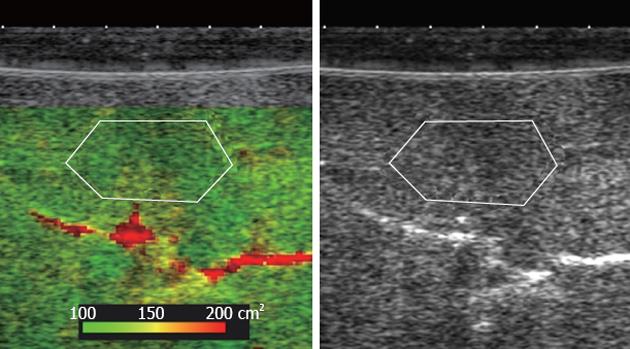
Figure 1 Acoustic structure quantification imaging.
In parametric imaging, the intensity distribution can be visualized and displayed on a split screen by color coding. The large-region of interest was set at a fixed depth of 2.5 mm from the liver surface.
- Citation: Kuroda H, Kakisaka K, Kamiyama N, Oikawa T, Onodera M, Sawara K, Oikawa K, Endo R, Takikawa Y, Suzuki K. Non-invasive determination of hepatic steatosis by acoustic structure quantification from ultrasound echo amplitude. World J Gastroenterol 2012; 18(29): 3889-3895
- URL: https://www.wjgnet.com/1007-9327/full/v18/i29/3889.htm
- DOI: https://dx.doi.org/10.3748/wjg.v18.i29.3889


