Copyright
©2012 Baishideng Publishing Group Co.
World J Gastroenterol. Jul 7, 2012; 18(25): 3223-3234
Published online Jul 7, 2012. doi: 10.3748/wjg.v18.i25.3223
Published online Jul 7, 2012. doi: 10.3748/wjg.v18.i25.3223
Figure 1 Fractionation of the aqueous extract of Nardostachys jatamansi.
NJ: Nardostachys jatamansi; HPLC: High-performance liquid chromatography.
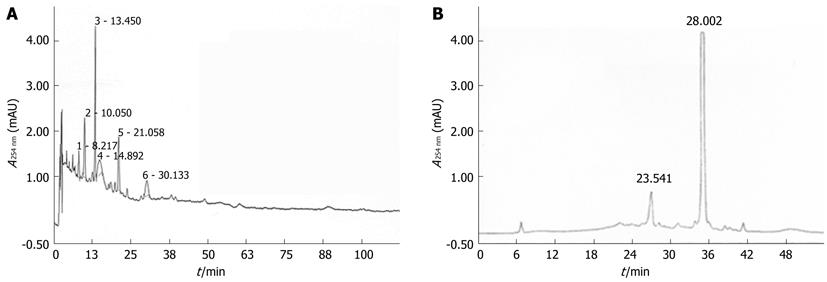
Figure 2 High-performance liquid chromatography findings of the aqueous extract of Nardostachys jatamansi (A) and the 4th fraction of Nardostachys jatamansi (B).
Figure 3 Effects of the 4th fraction of Nardostachys jatamansi on inflammatory events in the pancreas after pancreatitis.
A: Representative hematoxylin-eosin stained sections of the pancreas in the control mice not administered cerulein, in mice given cerulein, and in mice given Nardostachys jatamansi (NJ) (1 mg/kg, 5 mg/kg, or 10 mg/kg) 1 h before the first cerulein injection; B: Neutrophil infiltration was assessed on the basis of myeloperoxidase activity. This figure shows representative images of 1 experiment that involved 6 mice. The results were similar in 3 additional experiments. aP < 0.05 vs the saline treatment; cP < 0.05 vs cerulein treatment alone. Original magnification: × 100. AP: Acute pancreatitis.
Figure 4 Effects of the 4th fraction of Nardostachys jatamansi on acute pancreatitis-associated lung injury.
A: Representative hematoxylin-eosin stained sections of the lung in the control mice not given cerulein, in mice given cerulein, and in mice given Nardostachys jatamansi (NJ) (1 mg/kg, 5 mg/kg, or 10 mg/kg) 1 h before the first cerulein injection; B: Neutrophil infiltration was assessed on the basis of myeloperoxidase activity. This figure shows representative images from 1 experiment that involved 6 mice. The results were similar in 3 additional experiments. aP < 0.05 vs the saline treatment; cP < 0.05 vs cerulein treatment alone. Original magnification: × 100. AP: Acute pancreatitis.
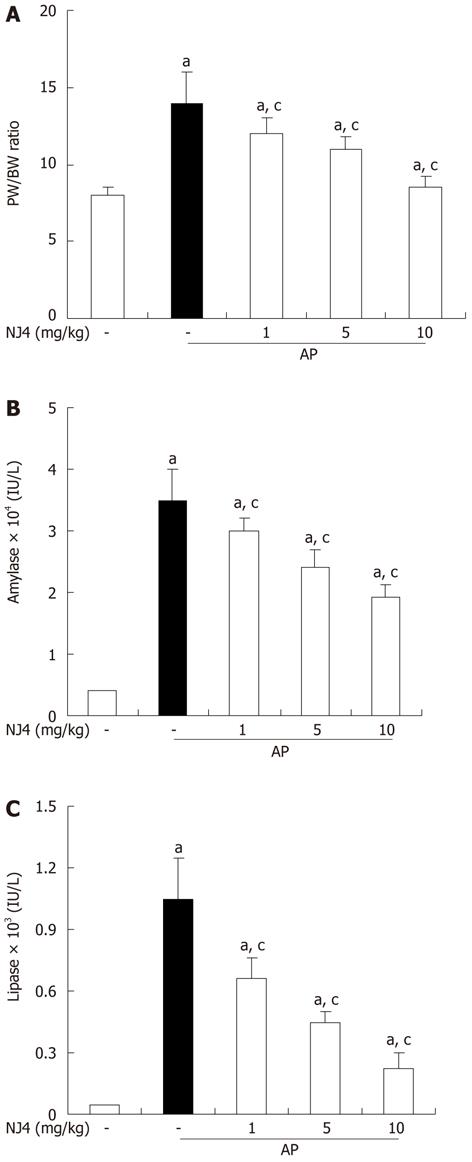
Figure 5 Effects of the 4th fraction of Nardostachys jatamansi pretreatment on pancreatic weight/body weight (A), serum amylase activity (B), and serum lipase activity (C) during cerulein-induced acute pancreatitis.
Mice pretreated with Nardostachys jatamansi (NJ) were challenged with intraperitoneal injections of cerulein (50 μg/kg). Mice were killed 6 h after the last cerulein injection. Their serum and pancreas were harvested and (A) pancreatic weight (PW)/body weight (BW) ratio and the levels of digestive enzymes such as (B) amylase and (C) lipase were measured as indicated in the experimental protocol. Data show the mean ± SE for 6 mice in 1 group. The results were similar in 3 additional experiments. aP < 0.05 vs the saline treatment; cP < 0.05 vs cerulein treatment alone. AP: Acute pancreatitis.
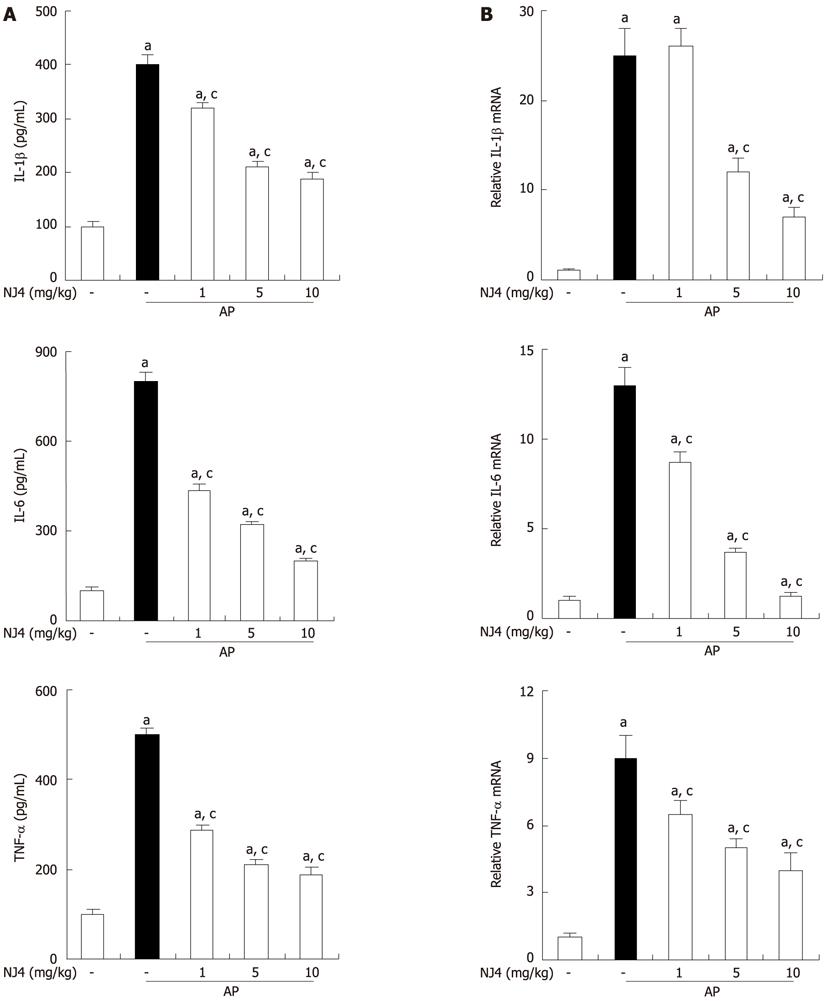
Figure 6 Effects of the 4th fraction of Nardostachys jatamansi on interleukin 1, interleukin 6, and tumor necrosis factor during cerulein-induced pancreatitis.
Mice pretreated with Nardostachys jatamansi (NJ) were challenged with intraperitoneal injections of cerulein at a supramaximal dose (50 μg/kg). Mice were killed at 6 h after the last cerulein injection. Levels of serum cytokines were measured by enzyme-linked immunosorbent assay (A). Levels of pancreatic mRNA for interleukin (IL)-1, IL-6, and tumor necrosis factor (TNF)-α were quantified using real-time reverse transcriptase polymerase chain reaction (B). Data show the mean ± SE for 6 mice in 1 group. The results were similar in 3 additional experiments. aP < 0.05 vs the saline treatment; cP < 0.05 vs cerulein treatment alone. AP: Acute pancreatitis.
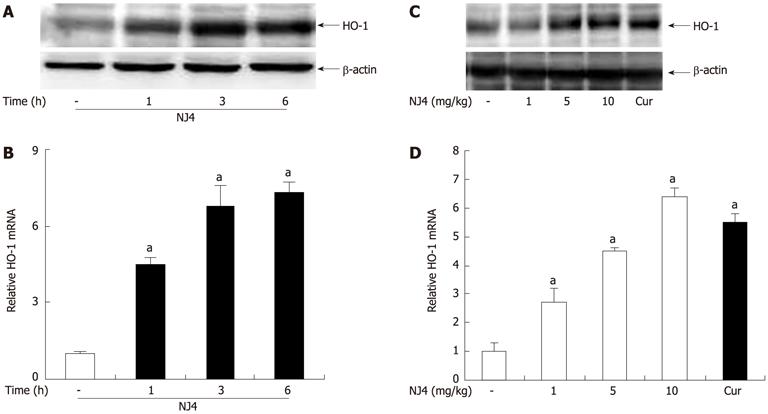
Figure 7 Effects of the 4th fraction of Nardostachys jatamansi on heme oxygenase-1 expression in the pancreas.
Mice were treated with saline, or Nardostachys jatamansi (NJ) (10 mg/kg). Then, the pancreas was harvested at the indicated time. A: The protein level of heme oxygenase-1 (HO-1) in the pancreas was measured using Western blotting. β-actin was used as the loading control; B: The mRNA expression of HO-1 was measured using real-time reverse transcriptase polymerase chain reaction (RT-PCR). Mice were treated with the indicated dose of NJ4. At 6 h after NJ4 injection, the pancreas was harvested; C: The protein level of HO-1 in the pancreas was measured using Western blotting. β-actin was used as the loading control; D: The mRNA expression of HO-1 was measured using real-time RT-PCR. The results were similar in 3 additional experiments. aP < 0.05 vs the saline treatment. Cur: Curcumin.
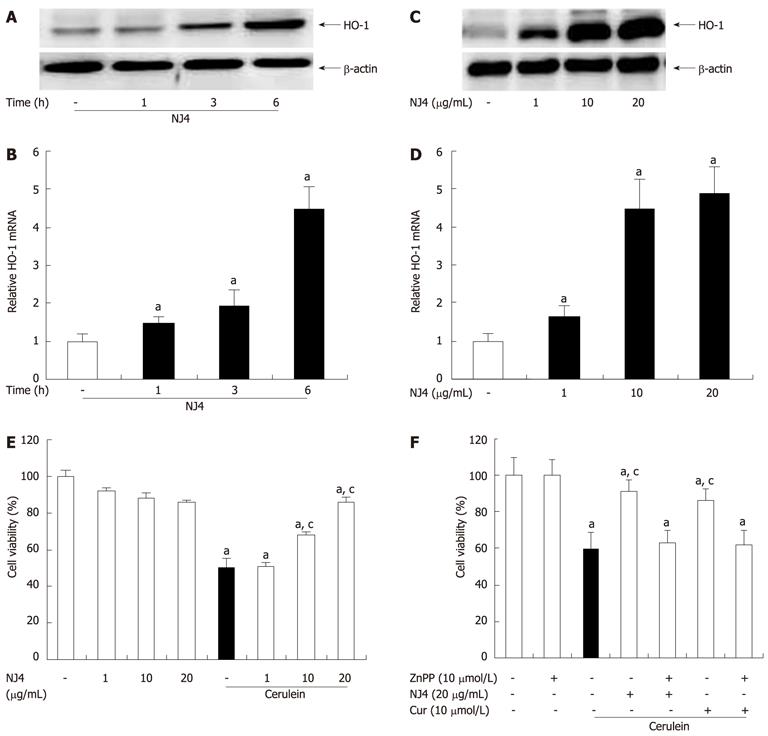
Figure 8 Effects of the 4th fraction of Nardostachys jatamansi on heme oxygenase-1 expression in acinar cells and cerulein-induced acinar cell death.
Pancreatic acinar cells were pretreated with Nardostachys jatamansi (NJ) (20 μg/mL), and then the cells were harvested at the indicated time. A, B: The protein level (A) and mRNA level (B) of heme oxygenase-1 (HO-1) in pancreatic acini were measured. Pancreatic acinar cells were pretreated with the indicated dose of NJ4. Then, the cells were harvested at 6 h; C, D: The protein level (C) and mRNA level (D) of HO-1 in the pancreatic acini were detected. The pancreatic acinar cells were pretreated with the indicated dose of NJ4 and then stimulated with cerulein (10 nmol/L); E: After 6 h of cerulein stimulation, cell viability was measured as described in the experimental protocol. Pancreatic acinar cells were pretreated with ZnPP (10 μmol/L), an HO-1 inhibitor, for 1 h and then treated with NJ4 (20 μg/mL), curcumin (10 μmol/L); F: At 1 h after treatment, cerulein (10 nmol/L) was added; After 6 h of cerulein stimulation, cell viability was measured. The results were similar in 3 additional experiments. aP < 0.05 vs the saline treatment; cP < 0.05 vs cerulein treatment alone. Cur: Curcumin.
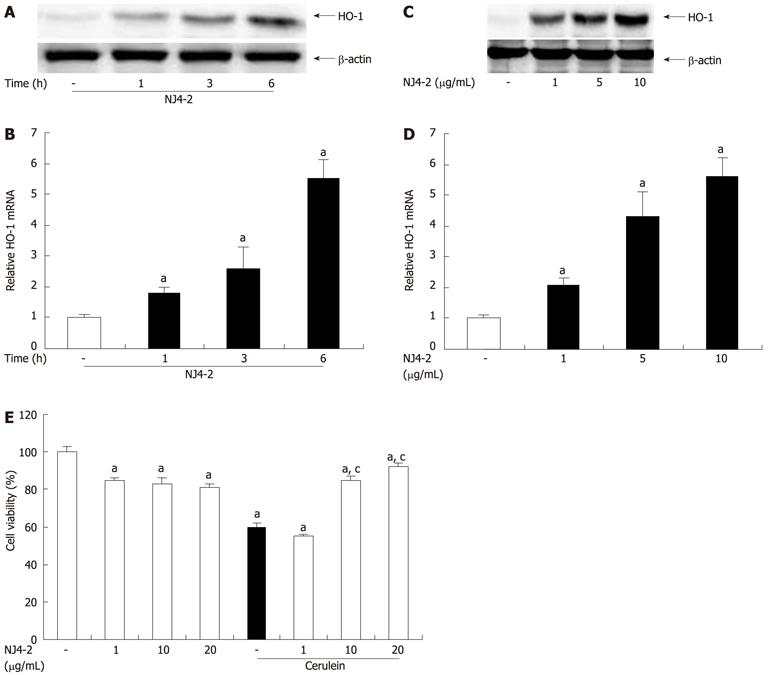
Figure 9 Effects of Nardostachys jatamansi-2 on heme oxygenase-1 expression in acinar cells and cerulein-induced acinar cell death.
Pancreatic acinar cells were pretreated with Nardostachys jatamansi (NJ4)-2 (10 μg/mL), and then the cells were harvested at the indicated time. A, B: The protein level (A) and mRNA level (B) of heme oxygenase-1 (HO-1) in pancreatic acini were measured. Pancreatic acinar cells were pretreated with the indicated dose of NJ4-2; C, D: Then, the cells were harvested at 6 h, the protein level (C) and mRNA level (D) of HO-1 in the pancreatic acini were detected. The pancreatic acinar cells were pretreated with the indicated dose of NJ4 and then stimulated with cerulein (10 nmol/L); E: After 6 h of cerulein stimulation, cell viability was measured as described in the experimental protocol. The results were similar in 3 additional experiments. aP < 0.05 vs the saline treatment; cP < 0.05 vs cerulein treatment alone.
-
Citation: Bae GS, Kim MS, Park KC, Koo BS, Jo IJ, Choi SB, Lee DS, Kim YC, Kim TH, Seo SW, Shin YK, Song HJ, Park SJ. Effect of biologically active fraction of
Nardostachys jatamansi on cerulein-induced acute pancreatitis. World J Gastroenterol 2012; 18(25): 3223-3234 - URL: https://www.wjgnet.com/1007-9327/full/v18/i25/3223.htm
- DOI: https://dx.doi.org/10.3748/wjg.v18.i25.3223


