Copyright
©2012 Baishideng Publishing Group Co.
World J Gastroenterol. Jun 28, 2012; 18(24): 3105-3111
Published online Jun 28, 2012. doi: 10.3748/wjg.v18.i24.3105
Published online Jun 28, 2012. doi: 10.3748/wjg.v18.i24.3105
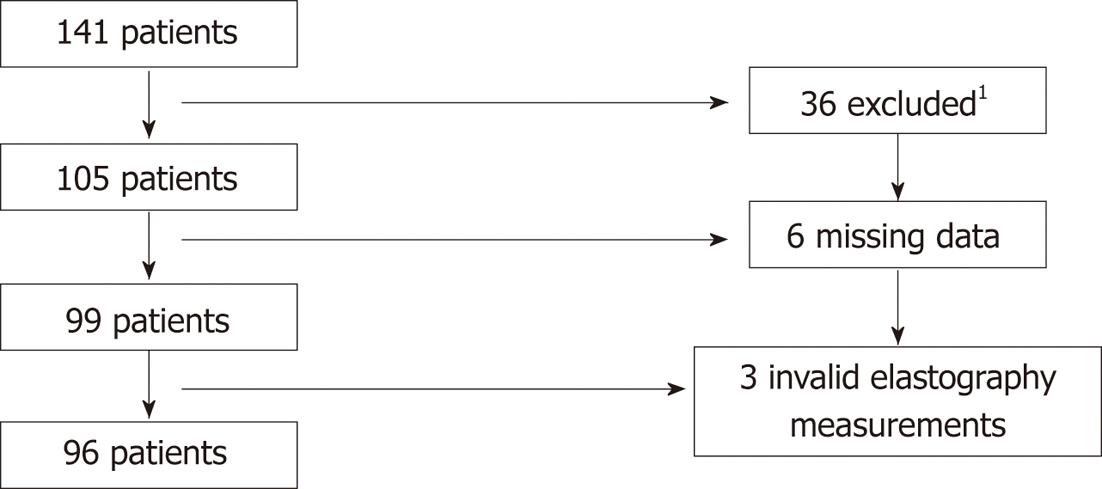
Figure 1 Flow chart for inclusion of patients.
1Exclusion due to: Not Swedish speaking, presence of Down’s disease, dementia, current pregnancy, severe psychiatric disease, co-existing hepatic disease (hepatitis B or C, hemochromatosis, recent diagnosis of liver cancer) or patients who had moved to other parts of the country or declined to participate (n = 4).
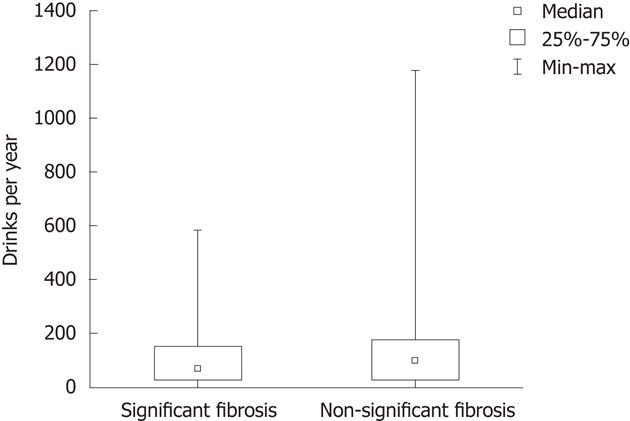
Figure 2 Comparison between the total mean units of alcohol per year for the significant and non-significant fibrosis group.
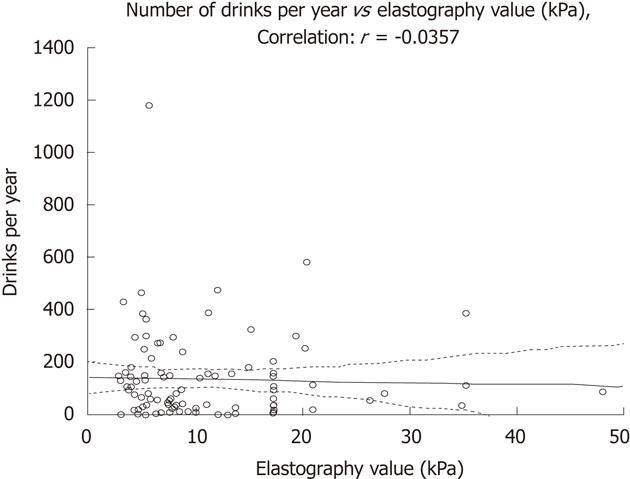
Figure 3 Correlation between elastography values and units per year.
Patients with clinically significant fibrosis but not a valid elastogram were given the value of 17.3 kPa.
- Citation: Hagström H, Stål P, Stokkeland K, Bergquist A. Alcohol consumption in patients with primary sclerosing cholangitis. World J Gastroenterol 2012; 18(24): 3105-3111
- URL: https://www.wjgnet.com/1007-9327/full/v18/i24/3105.htm
- DOI: https://dx.doi.org/10.3748/wjg.v18.i24.3105


