Copyright
©2012 Baishideng Publishing Group Co.
World J Gastroenterol. Jun 21, 2012; 18(23): 2929-2937
Published online Jun 21, 2012. doi: 10.3748/wjg.v18.i23.2929
Published online Jun 21, 2012. doi: 10.3748/wjg.v18.i23.2929
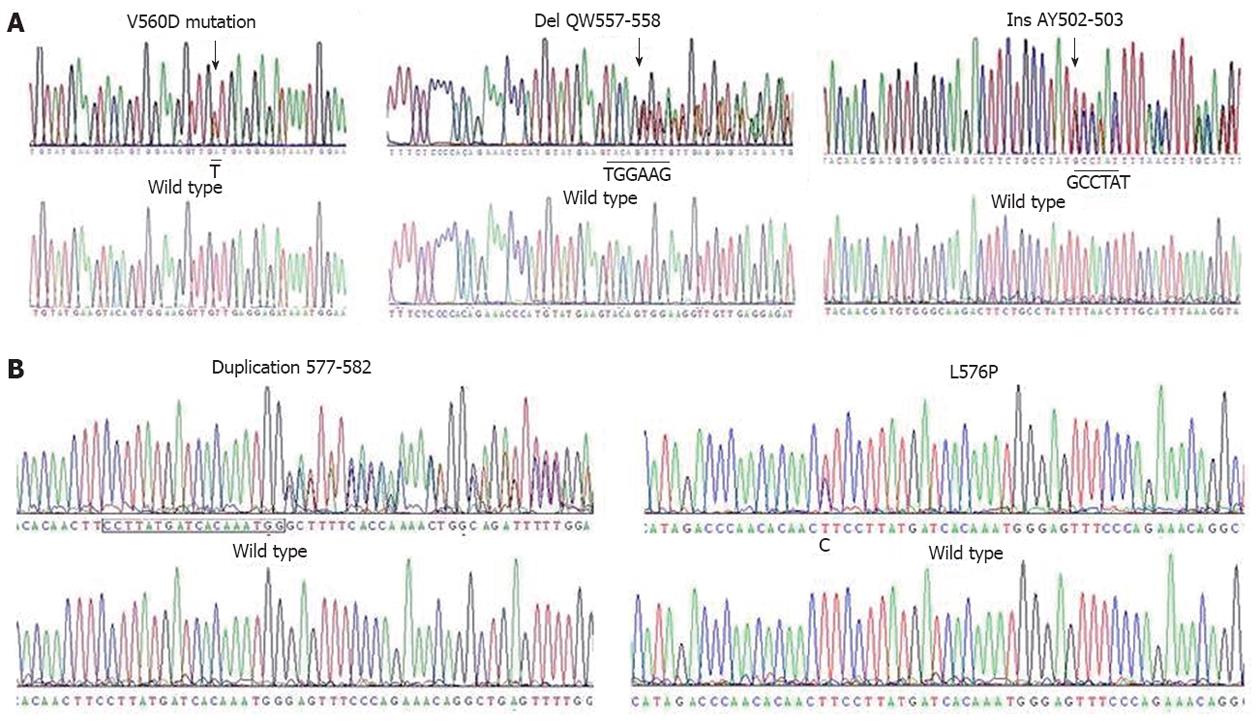
Figure 1 Heterozygous c-kit mutations in primary gastrointestinal stromal tumors.
The mutant nucleotide sequence is indicated in the upper diagram, and the wild-type nucleotide sequence is indicated in the lower diagram. Nucleotide changes are shown in red capital letters. A: Cryopreserved specimens; B: Fresh specimens.
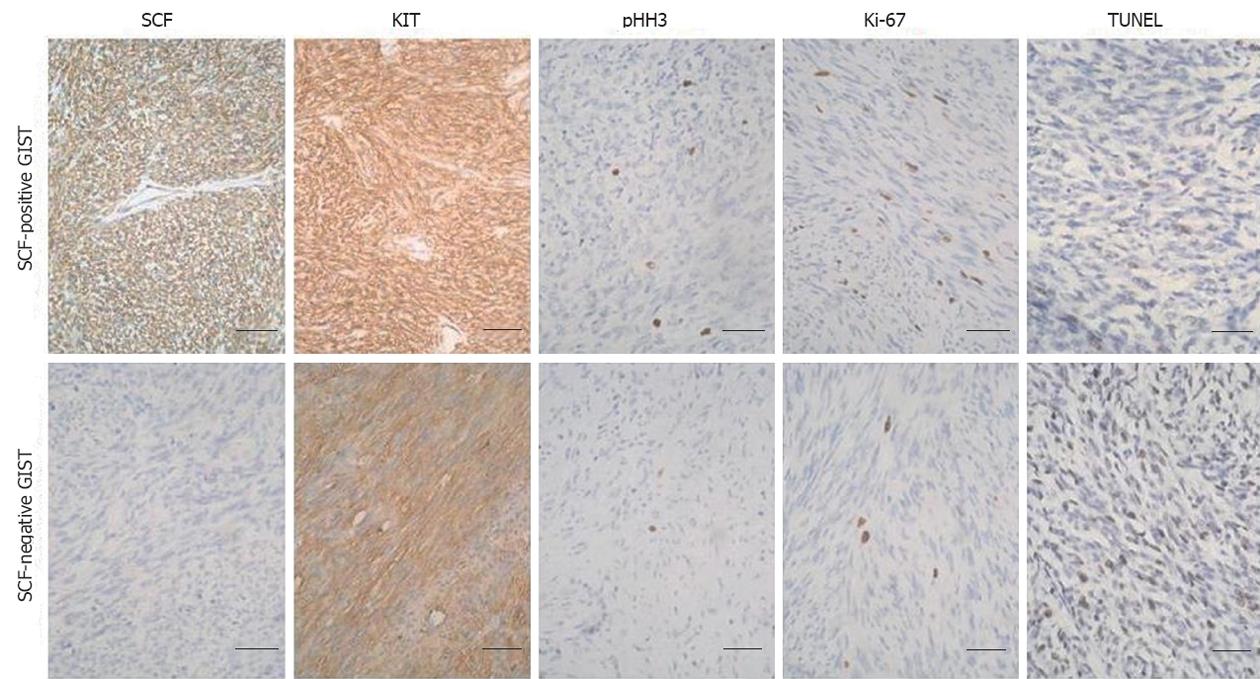
Figure 2 The expression of stem cell factor in primary gastrointestinal stromal tumors.
Sections of gastrointestinal stromal tumors (GISTs) (n = 51) were immunostained with stem cell factor (SCF), KIT (CD117), pHH3 and Ki-67 antibodies (magnification, ×200). Apoptosis was assessed in situ by terminal deoxynucleotidyl transferase-mediated dUTP-biotin nick end labeling (TUNEL) staining (magnification, ×200). Representative images are shown. Bar = 50 μm.
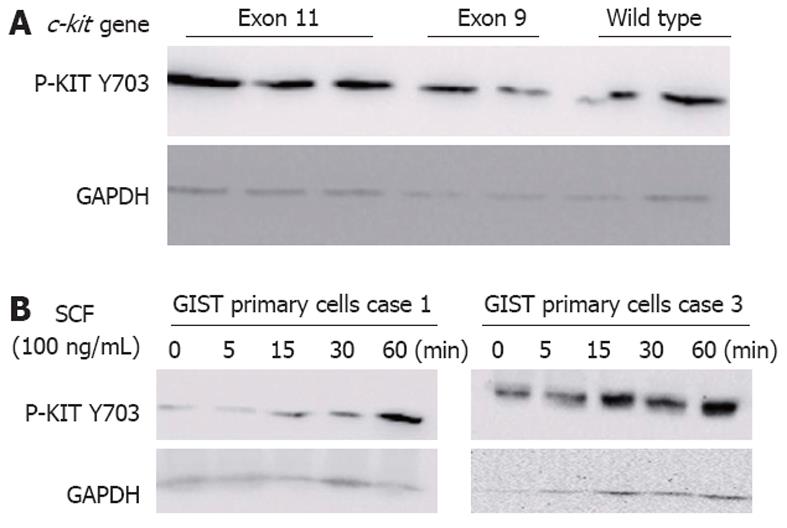
Figure 3 Western blotting analysis of phosphorylated KIT.
A: KIT phosphorylation (p-KIT Y703) was analysed in gastrointestinal stromal tumor (GIST) samples (n = 51). A representative western blotting of p-KIT Y703 (top) and glyceraldehyde 3-phosphate dehydrogenase (GAPDH) (bottom) in patients with exon 11 or 9 mutations or wild-type c-kit-bearing tumors; B: GIST primary cells were incubated with 100 ng/mL stem cell factor (SCF) for the indicated times. KIT phosphorylation (p-KIT Y703) was analysed by western blotting.
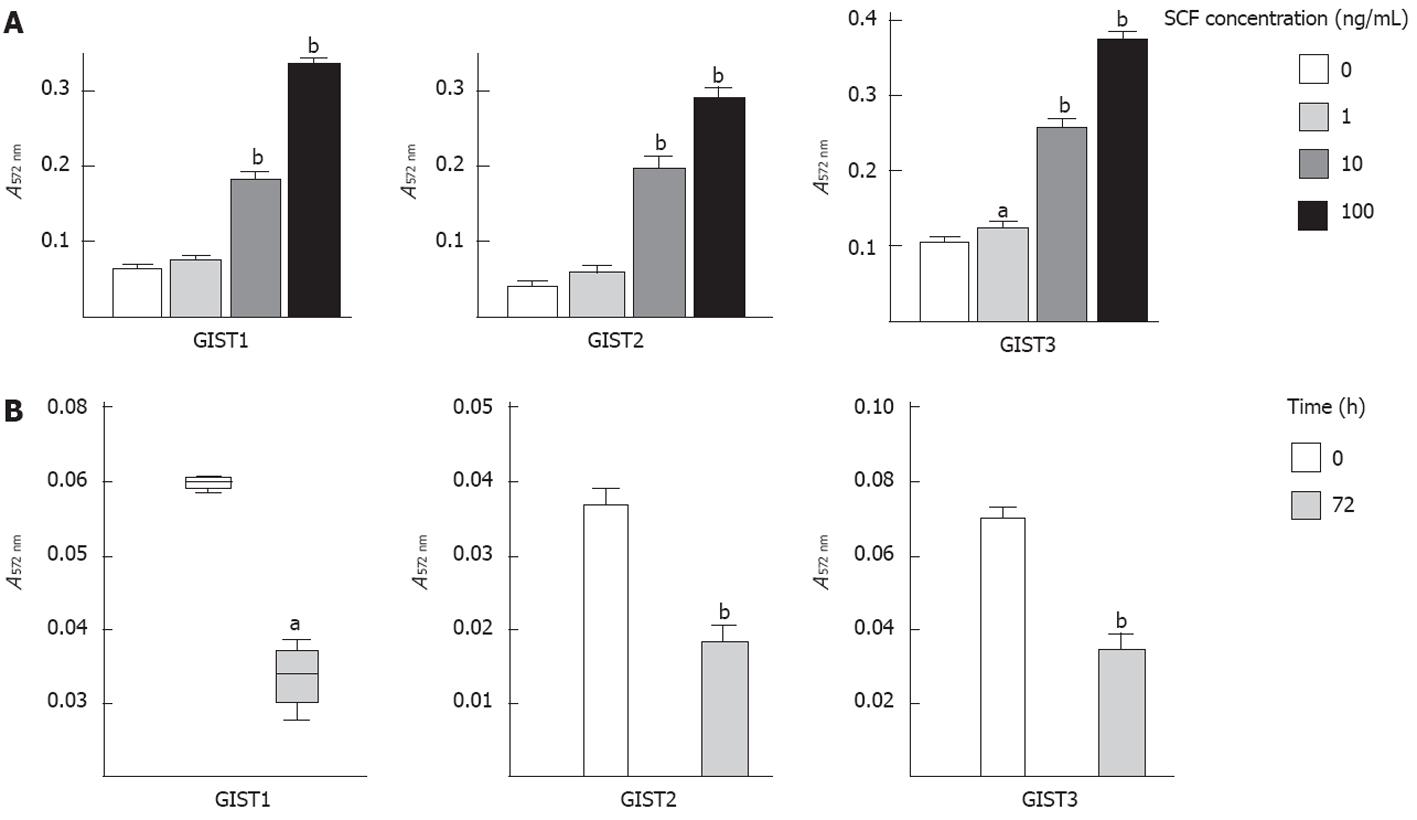
Figure 4 Stem cell factor stimulates gastrointestinal stromal tumors cell proliferation in vitro.
Gastrointestinal stromal tumor (GIST) primary cells were incubated for 72 h with exogenous stem cell factor (SCF) (0-100 ng/mL, A) or KIT immunoblocking antibody (100 ng/mL, B), cell proliferation was analysed by methyl thiazolyl tetrazolium assay. The data are presented as the mean ± SD (n = 4 for each). aP < 0.05, bP < 0.01 vs untreated cells.
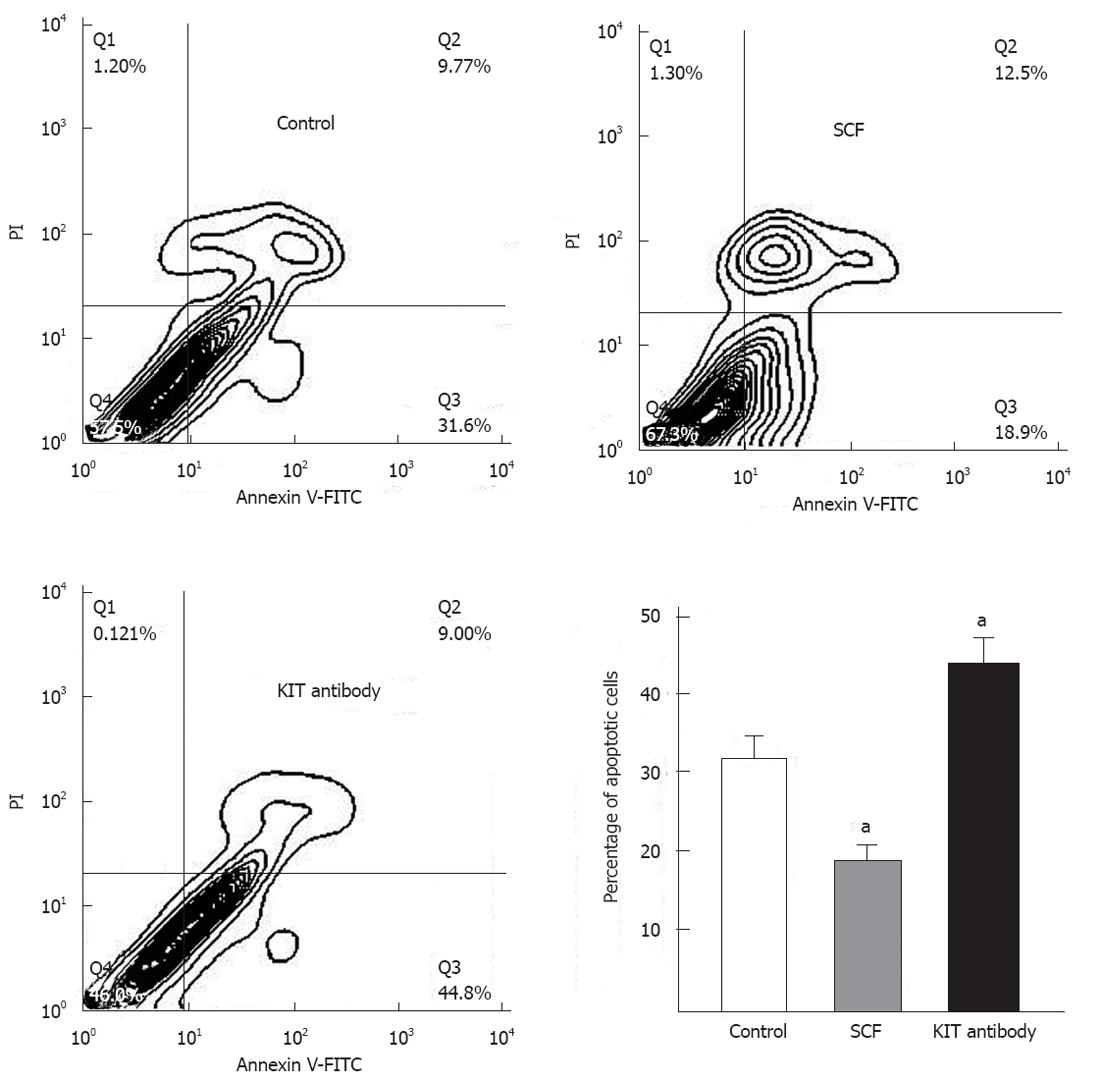
Figure 5 Stem cell factor inhibits gastrointestinal stromal tumor cell apoptosis in vitro.
Representative flow cytometric contour of annexin V-fluorescein isothiocyanate (FITC)/propidium iodide (PI) dual-colour flow cytometry after 12 h of treatment with exogenous stem cell factor (SCF) or KIT immunoblocking antibody. The lower right quadrant represents early apoptotic cells. The data are presented as the mean ± SD (n = 4 for each). aP < 0.01 vs untreated cells.
- Citation: Bai CG, Hou XW, Wang F, Qiu C, Zhu Y, Huang L, Zhao J, Xu JJ, Ma DL. Stem cell factor-mediated wild-type KIT receptor activation is critical for gastrointestinal stromal tumor cell growth. World J Gastroenterol 2012; 18(23): 2929-2937
- URL: https://www.wjgnet.com/1007-9327/full/v18/i23/2929.htm
- DOI: https://dx.doi.org/10.3748/wjg.v18.i23.2929


