Copyright
©2012 Baishideng Publishing Group Co.
World J Gastroenterol. May 7, 2012; 18(17): 2084-2091
Published online May 7, 2012. doi: 10.3748/wjg.v18.i17.2084
Published online May 7, 2012. doi: 10.3748/wjg.v18.i17.2084
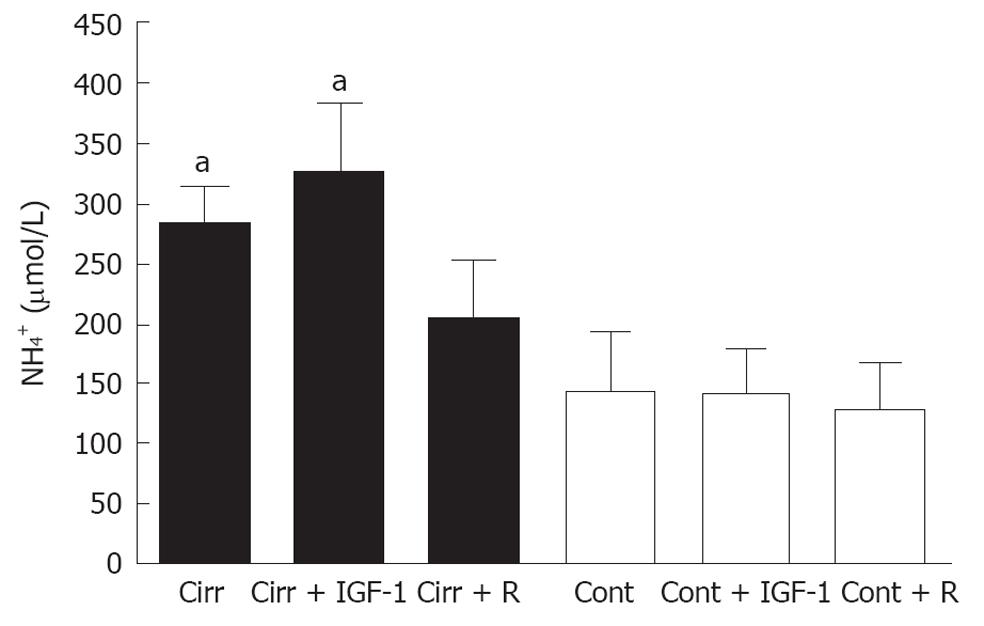
Figure 1 Blood ammonia levels.
Comparison of the concentrations of basal plasma ammonia in cirrhotic groups (closed bars) and control groups (open bars). Cirrhosis plus portal vein occlusion resulted in a significant increase in basal ammonia levels. Rifaximin-treated cirrhotic rats showed plasma ammonia levels similar to those observed in controls; by contrast, insulin-like growth factor (IGF)-1 treatment was unable to normalize these values. aP < 0.05 vs each control group. Cirr: Cirrhosis; Cont: Control; R: Rifaximin.
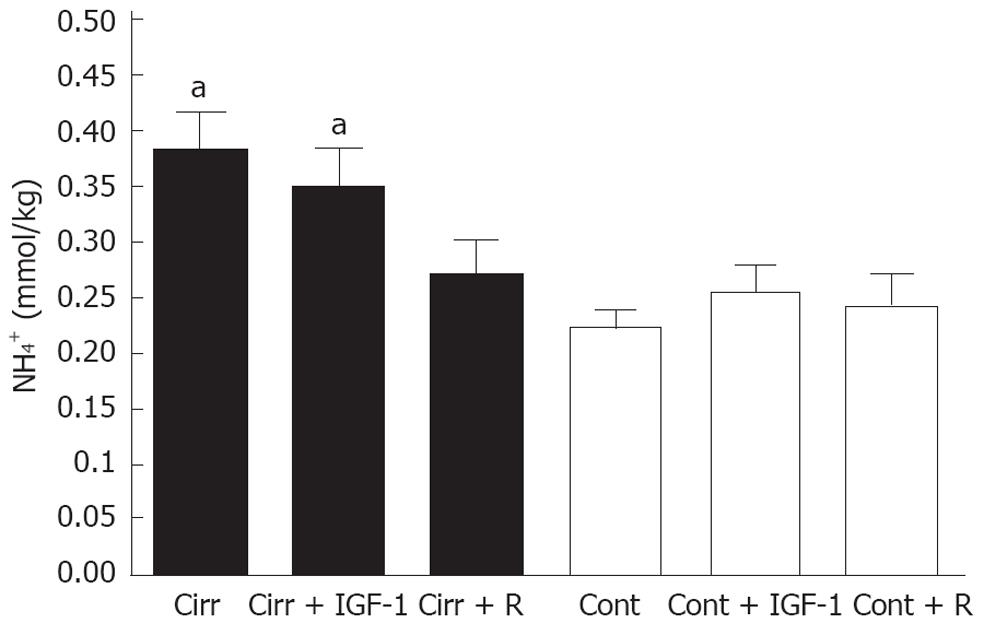
Figure 2 Brain ammonia levels.
Comparison of the concentrations of brain ammonia in cirrhotic groups (closed bars) and control groups (open bars). Liver cirrhosis plus portal vein occlusion resulted in an increase in brain ammonia levels compared to controls, whereas in rifaximin-treated cirrhotic rats, these levels remained similar to those in controls. insulin-like growth factor (IGF)-1 did not significantly decrease these values compared to the respective controls. aP < 0.05 vs each control group. Cirr: Cirrhosis; Cont: Control; R: Rifaximin.
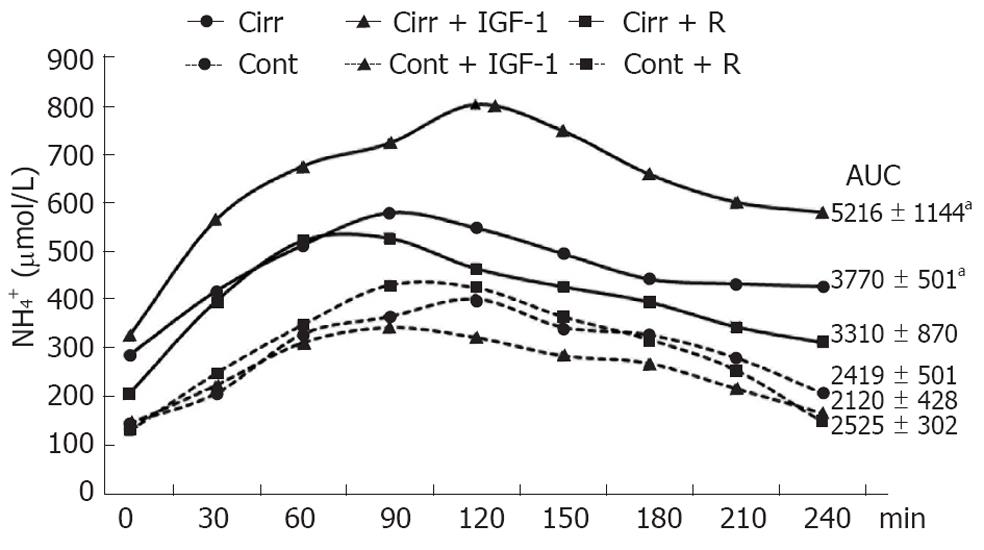
Figure 3 Ammonia response to oral glutamine-challenge tests.
The area under the curve (AUC) was significantly increased by both placebo and insulin-like growth factor (IGF)-1-treatment in cirrhotic rats. By contrast, the AUC in rifaximin-treated cirrhotic rats was similar to that observed in controls. Cirr: Cirrhosis; Cont: Control; R: Rifaximin.
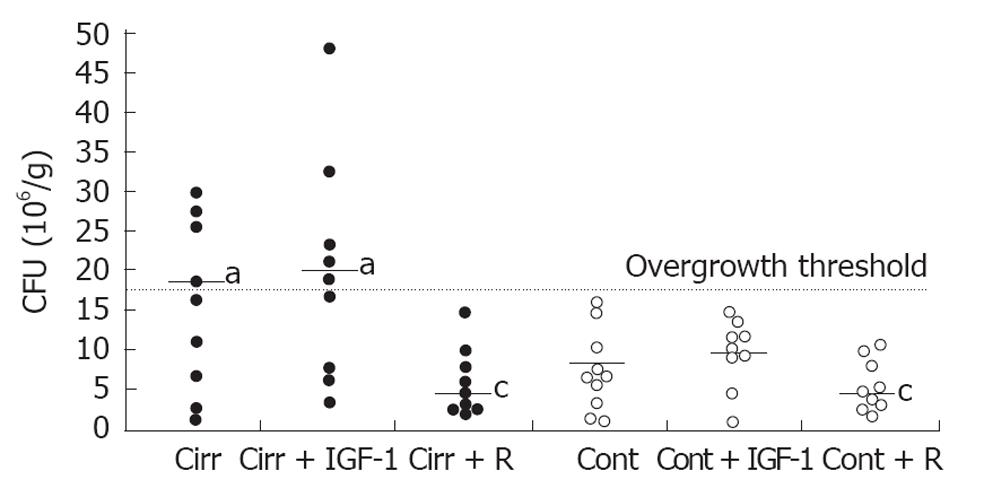
Figure 4 Cecal bacterial populations.
Comparison of cecal bacterial content in cirrhotic groups (●) and control groups (○). Bacterial overgrowth was defined as a colony-forming units (CFU) count greater than the mean ± 2SD of the control group (dashed line). CCl4-induced cirrhosis plus portal vein occlusion resulted in cecal bacterial overgrowth in placebo and insulin-like growth factor (IGF)-1-treated cirrhotic rats (aP < 0.05 vs all others). Rifaximin treatment reduced bacterial content in cirrhotic rats to a level similar to that observed in the rifaximin-treated control group; bacterial counts in these latter groups were the lowest among all groups (cP < 0.05). Cirr: Cirrhosis; Cont: Control; R: Rifaximin.
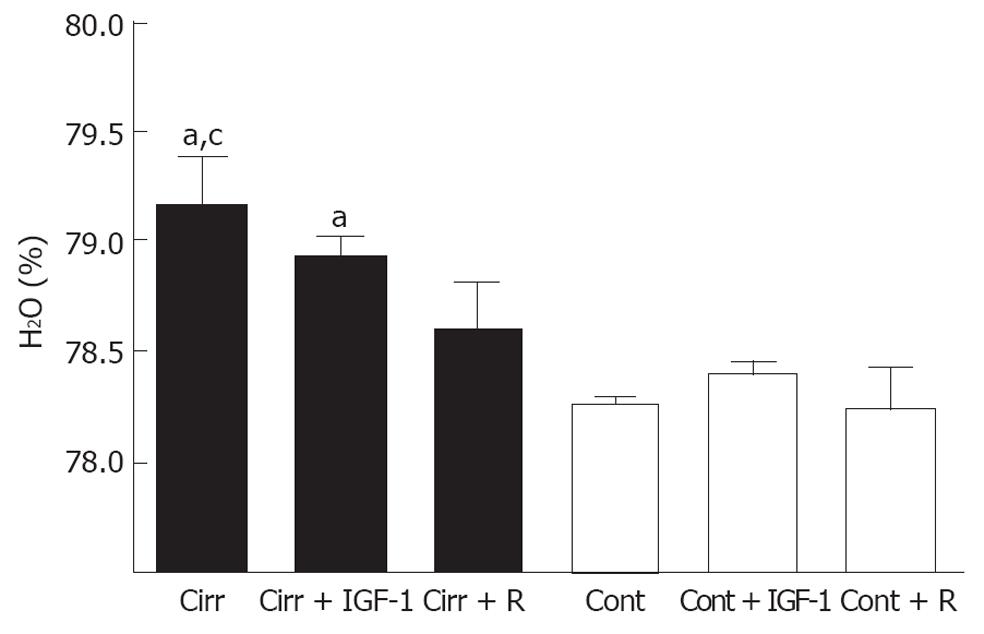
Figure 5 Low-grade brain edema.
Low-grade brain edema was determined by measuring the percentage brain water content in cirrhotic groups (closed bars) and control groups (open bars). Placebo-treated cirrhotic rats showed the presence of low-grade brain edema. Brain water content in rifaximin-treated cirrhotic rats was similar to that in control groups, and was significantly lower to that observed in placebo-treated cirrhotic rats. Insulin-like growth factor (IGF)-1 treatment did not diminish brain edema; brain water content in the cirrhosis + IGF-1 group was similar to that observed in the cirrhosis + placebo group. aP < 0.05 vs all control groups; cP < 0.05 vs cirrhosis + R. Cirr: Cirrhosis; Cont: Control; R: Rifaximin.
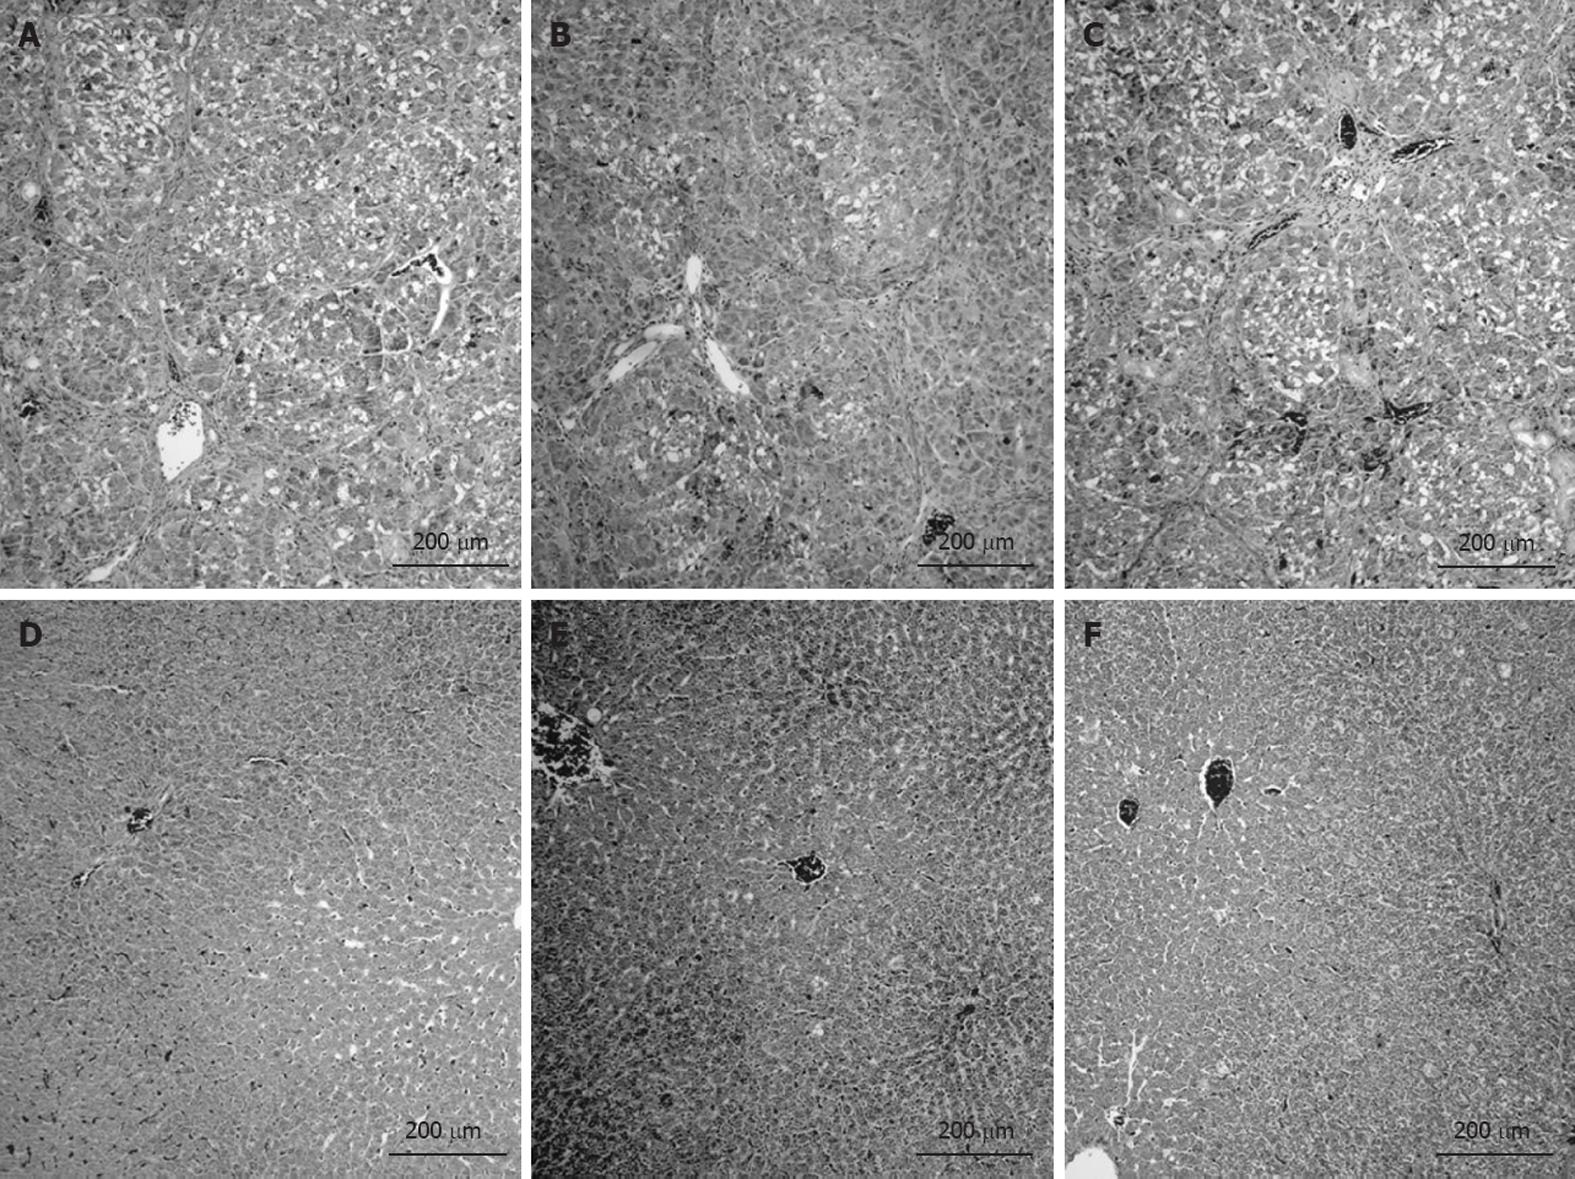
Figure 6 Photomicrographs of liver sections.
All cirrhotic rats developed micronodular cirrhosis with regeneration nodules, necrosis and steatosis regardless of treatment (A: Cirrhosis; B: Cirrhosis + IGF-1; C: Cirrhosis + rifaximin). All control rats showed normal cellular architecture (D: Control; E: Control + IGF-1; F: Control + rifaximin).
- Citation: Òdena G, Miquel M, Serafín A, Galan A, Morillas R, Planas R, Bartolí R. Rifaximin, but not growth factor 1, reduces brain edema in cirrhotic rats. World J Gastroenterol 2012; 18(17): 2084-2091
- URL: https://www.wjgnet.com/1007-9327/full/v18/i17/2084.htm
- DOI: https://dx.doi.org/10.3748/wjg.v18.i17.2084


