Copyright
©2012 Baishideng Publishing Group Co.
World J Gastroenterol. Apr 7, 2012; 18(13): 1485-1495
Published online Apr 7, 2012. doi: 10.3748/wjg.v18.i13.1485
Published online Apr 7, 2012. doi: 10.3748/wjg.v18.i13.1485
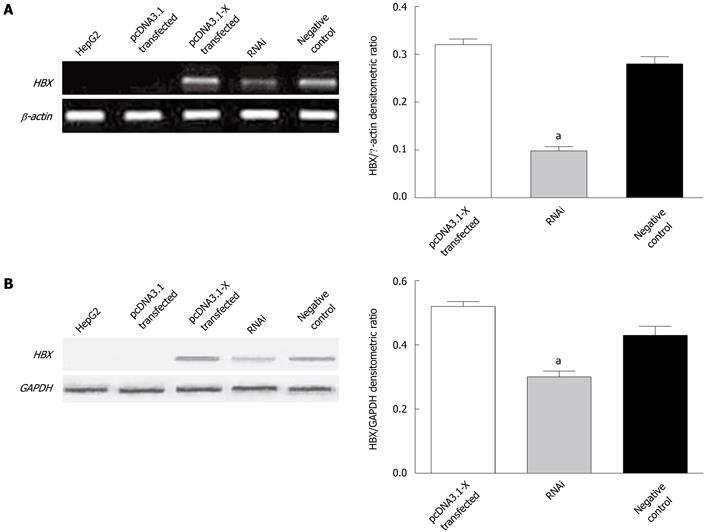
Figure 1 Detection of hepatitis B virus X protein expression in transfected HepG2 cells.
HepG2 cells were transfected with pcDNA3.1-X plasmids or cotransfected with pcDNA3.1-X and pSilencer3.1-shHBX plasmids. Forty-eight hours later, the expression of hepatitis B virus X protein (HBx) in HepG2 cells was determined by reverse transcription polymerase chain reaction (A) and Western blotting analysis (B). HepG2 group was not transfected with any plasmids. pcDNA3.1 transfected group was transfected with plasmid pcDNA3.1; pcDNA3.1-X transfected group was transfected with pcDNA3.1-X; RNAi group was cotransfected with pcDNA3.1-X and pSilencer3.1-shHBX in a ratio of 1:3; negative control group was cotransfected with pcDNA3.1-X and negative control plasmid pSilencer3.1-H1 in a ratio of 1:3. Data are expressed as mean ± SD (n = 3), aP < 0.05 vs pcDNA3.1-X transfected group.
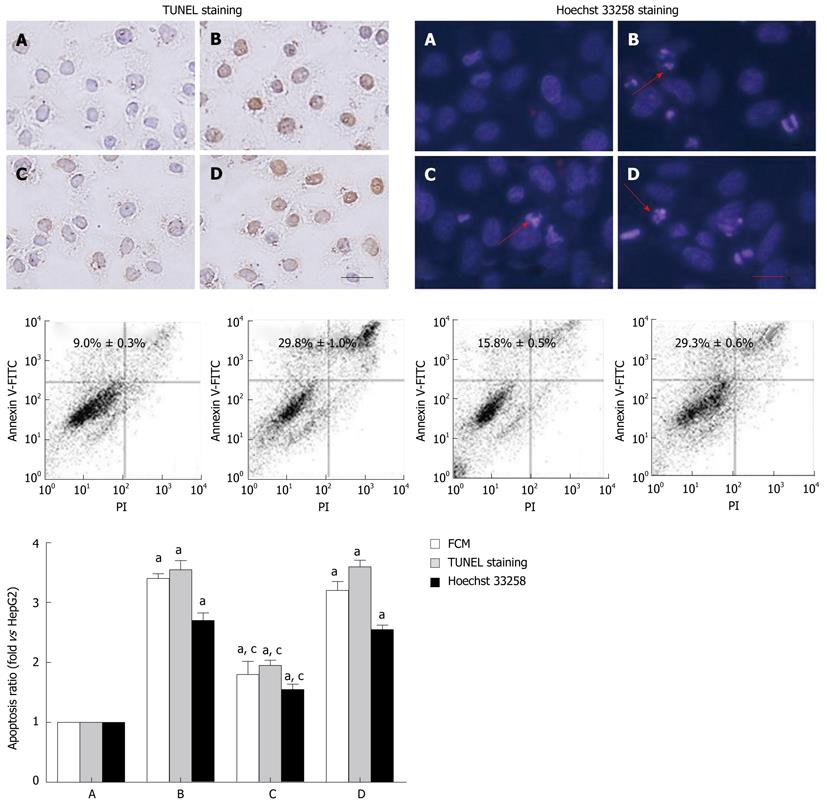
Figure 2 Apoptosis of HepG2 cells induced by hepatitis B virus X protein.
HepG2 cells were cotransfected with pcDNA3.1-X and pSilencer3.1-shHBX as RNAi group, and HepG2 cells were cotransfected with pcDNA3.1-X and pSilencer3.1-H1 plasmids as negative control. Cells were examined by TUNEL, Hoechst 33258 staining and flow cytometry as described in Materials and Methods. A: HepG2 group; B: pcDNA3.1-X transfected group; C: RNAi group; D: Negative control group. Data was expressed as mean ± SD (n = 3), aP < 0.05 vs the HepG2 group; cP < 0.05 vs pcDNA3.1-X transfected group and negative control group. Scale bar value: 5 μm. Red arrows indicate apoptotic nuclei. Apoptosis ratio= (apoptotic cells/total cells) × 100%. TUNEL: Terminal deoxynucleotidyl transferase-mediated dUTP-biotin nick end labeling.
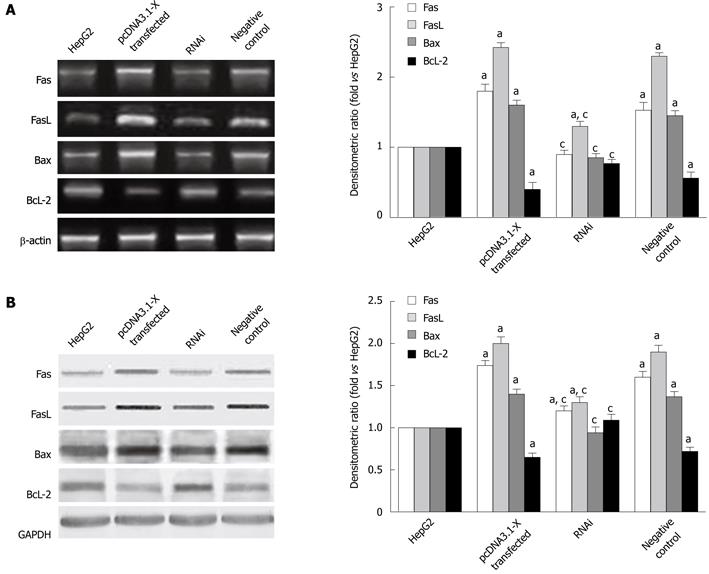
Figure 3 Expression of Fas, FasL, Bax, Bcl-2 mRNA and protein in HepG2 cells induced by hepatitis B virus X protein.
Transfection of HepG2 cells is described in Figure 2. Forty-eight hours after transfection, the mRNA (A) and protein (B) expression levels of Bax, Bcl-2, Fas and FasL were determined by RT-PCR and Western blotting analysis. Data are expressed as mean ± SD (n = 3), aP < 0.05 vs the HepG2 group; cP < 0.05 vs pcDNA3.1-X transfected group and negative control group.
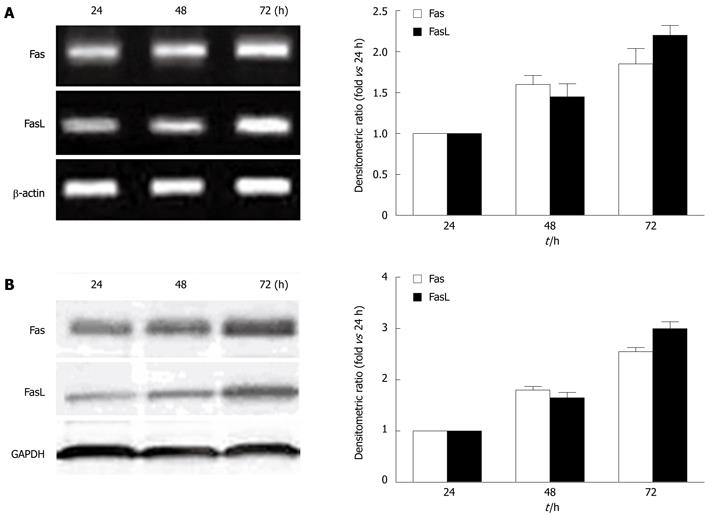
Figure 4 Upregulation of Fas/FasL signaling pathway-related protein expression by hepatitis B virus X protein in a time-dependent manner.
HepG2 cells were transfected with pcDNA3.1-X and incubated for various time periods as indicated. The levels of Fas, FasL mRNA (A) and proteins (B) were determined by reverse transcription polymerase chain reaction and Western blotting analysis. Data are expressed as mean ± SD (n = 3).
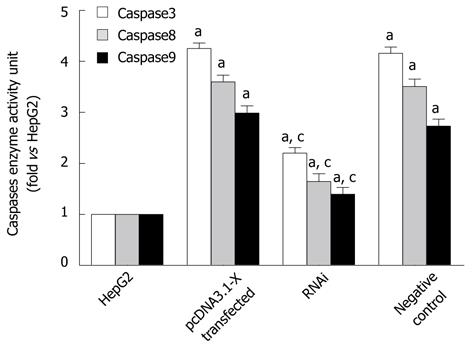
Figure 5 Detection of activated caspases in HepG2 cells transfected with hepatitis B virus X protein.
Transfection of HepG2 cells is described in Figure 2. Forty-eight hours after transfection, the enzyme activity of caspase3, caspase8 and caspase9 was analyzed by spectrophotometric test. Data are expressed as mean ± SD (n = 3), aP < 0.05 vs the HepG2 group; cP < 0.05 vs pcDNA3.1-X transfected group and negative control group.
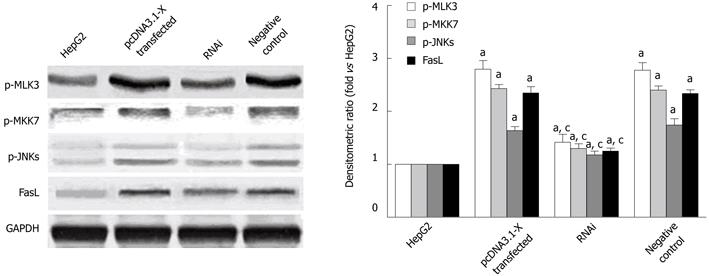
Figure 6 Activation of MLK3-MKK7-JNKs signaling module in hepatitis B virus X protein-transfected HepG2 cells.
Transfection of HepG2 cells is described in Figure 2. Forty-eight hours after transfection, the cells lysates were detected by Western blotting analysis. Data are expressed as mean ± SD (n = 3), aP < 0.05 vs the HepG2 group; cP < 0.05 vs pcDNA3.1-X transfected group and negative control group.
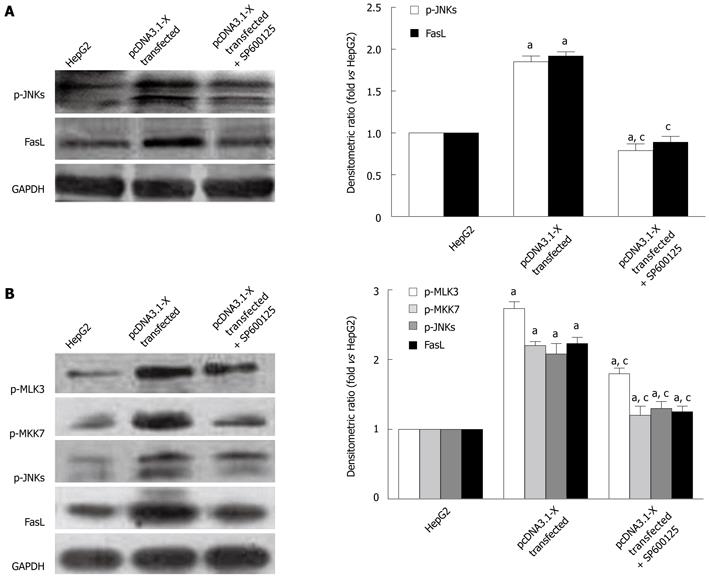
Figure 7 Activation of MLK3-MKK7-JNKs signaling module on FasL expression mediated by hepatitis B virus X protein.
A: HepG2 cells were cultured in 0.01% dimethyl sulfoxide (DMSO) in the absence or presence of 20 μmol/L SP600125 after transfection with pcDNA3.1-X and incubated for 24 h; B: HepG2 cells were cultured in 0.01% DMSO in the absence or presence of 300 nmol/L K252a after transfection with pcDNA3.1-X and incubated for 24 h. Cell lysates were prepared and electrophoresed in SDS-PAGE and subsequently performed by Western blotting analysis. Data are expressed as mean ± SD (n = 3), aP < 0.05 vs the HepG2 group; cP < 0.05 vs pcDNA3.1-X transfected group.
Figure 8 Inhibition of HBx-induced cell apoptosis by K252a.
HepG2 cells were cultured in 0.01% dimethyl sulfoxide in the absence or presence of 300 nmol/L K252a after transfection with pcDNA3.1-X and incubated for 24 h, and the cell apoptosis was examined by flow cytometry. A: HepG2 group; B: pcDNA3.1-X transfected group; C: pcDNA3.1-X transfected + K252a group. Data are expressed as mean ± SD (n = 3), aP < 0.05 vs the HepG2 group; cP < 0.05 vs pcDNA3.1-X transfected group.
- Citation: Tang RX, Kong FY, Fan BF, Liu XM, You HJ, Zhang P, Zheng KY. HBx activates FasL and mediates HepG2 cell apoptosis through MLK3-MKK7-JNKs signal module. World J Gastroenterol 2012; 18(13): 1485-1495
- URL: https://www.wjgnet.com/1007-9327/full/v18/i13/1485.htm
- DOI: https://dx.doi.org/10.3748/wjg.v18.i13.1485


